Background
Our client, operating in the UK, faced challenges in analyzing spending and expenses for its clients. The work process was largely manual, time-consuming, and prone to errors. Their consultants would spend much time asking for required data, calculating numbers, comparing them with benchmarks, and building cost-reduction plans.
One of the biggest problems was presenting the final results—consultants would use different tools of their choice. Our task was to create a sophisticated spend analysis platform that streamlines the process, requires minimal manual effort, offers automation features, and provides standardized interactive visualizations.
Challenges
Despite our end goal to have visually appealing reports based on the provided data, the following things had to be addressed:
- standardize the format of data shared by end clients
- design data ingestion pipelines and data processing
- build efficient analytical storage for future reports
Also, a supporting API layer was required, which the client needed to serve industry-specific benchmarks. New benchmarking data had to be regularly uploaded to the system and used for comparative analysis as a central part of the Business Intelligence solution.
Features
- Automated data ingestion
- Benchmarks management
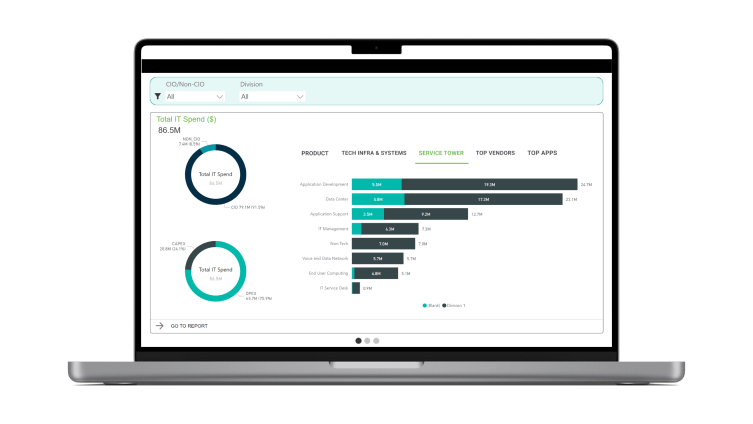
- Total spend overview, spend contribution, spend by business unit, spend by country, spend by vendor, spend by category, top N spends
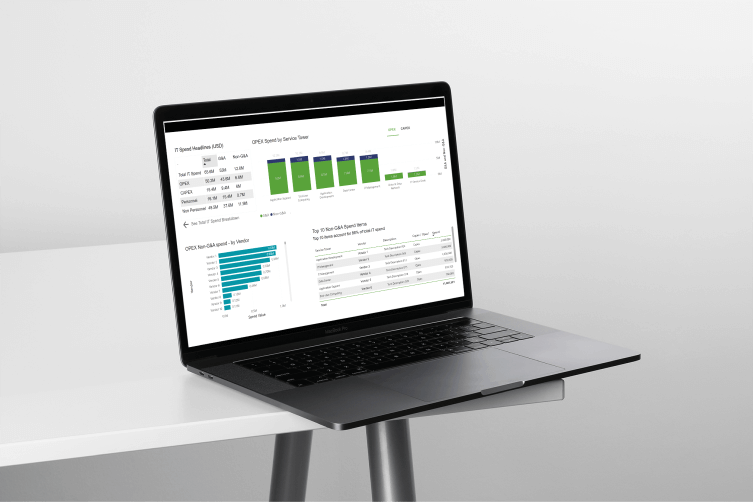
- G&A vs Non-G&A spends, Capex vs Opex spends, Personnel vs Non-Personnel spends
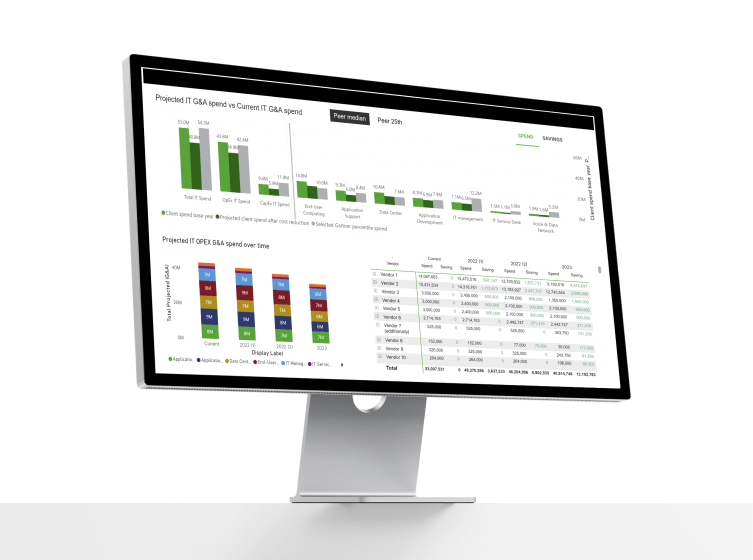
- Spend vs Gartner benchmarks, spend vs Computer Economics benchmarks
- Personnel spend vs. benchmarks
- Cost reduction plan
Solution
The provided technical solution consists of 4 puzzles:
- ASP.NET Core API for accessing global benchmarks
This tool makes it easy for users to access benchmarks from around the world that are relevant to their industry. It’s designed as an internal data source for Power BI, so users can compare different benchmarks easily.
- Azure Data Factory for secure data pipelines
We set up pipelines that securely pull spending data from client folders and store it in an MS SQL Server database.
- Power BI Template for dynamic reporting
We created a customizable Power BI template (PBIT) that lets business users tweak reports by entering different parameters, such as data paths, industry, fiscal years, and currency.
- Customizable theme and branding
Each report template has its own theme and branding that matches the organization’s style. We use Power BI JSON files to manage the report styles, so users get all the benefits of Power BI’s customization options.
Outcome
After having implemented an automated spend analysis BI solution and start using it in real cases, the following benefits have been spotted by users :
- Adopting the spend analysis platform has reduced the diversity of tools used among consultants by 100%. This standardization has improved overall communication effectiveness and presentation quality.
- Built reports led to quicker insights into spending patterns, saving time previously spent on manual data analysis. By minimizing the manual work, people could focus more on higher-value activities.
- Visualized data has increased client confidence in business cost reduction plans. Statistical comparisons with industry averages have provided clients with tangible evidence of potential savings opportunities, contributing to their trust in the proposed strategies. Cost reduction solutions provide the client with tremendous opportunities and advantages.


