Overview
Transforming Farm Data into Actionable Intelligence
An all-in-one platform simplifies agricultural data collection, from survey creation to field reports and campaign handling. Created for Super Admins, Regional Managers, and Field Technicians, it uses an Admin Portal and mobile app to provide consistent insights.
Teams can deploy complex survey workflows at scale with this solution, which includes automated conditional logic, multi-language support, and real-time progress tracking per farmer. Admins rapidly update question sets and campaigns. Field users get an offline, guided experience that boosts data accuracy and efficiency.
Headquarters
South Africa
Services
UI/UX Design; Front-end Development; Back-end Development
Business needs
Client request & business goals
Business Context & Requirements
The client needed a centralized solution for managing and scaling field data collection across regions. A reusable Question Bank allows administrators to assemble surveys quickly. Each survey supports automatic multi-language translation for local teams. The mobile app works offline, syncs results when back online, and integrates with ERPs for farmer lists and campaign data.
OUR ROLE
We developed an intuitive user experience, from wireframes and prototypes to a design system, ensuring clarity before development. We defined a clean information architecture, designed modular components for the Question Bank and Survey Builder, and mapped mobile workflows for Field Technicians, reducing training and improving data accuracy. Detailed specs and assets were handed off to teams for smooth implementation and consistent styling across web and mobile.
Stage 1: Stakeholder Interview
At the outset of our Discovery phase, we spoke directly with the key decision-makers to understand why they engaged us and what limitations they faced with their existing solution. They emphasized that, rather than replacing the platform entirely, they needed a thoughtful refresh—adding new features without forcing current users to learn a completely new product. The client provided a detailed list of pain points gathered from end-users, highlighting areas in need of improvement to enhance overall efficiency and usability.
KEY QUESTIONS WE ASKED
- What are the biggest time-wastes or frustrations your team faces today?
- Which new capabilities would feel most familiar yet valuable to your users?
- How important is preserving the existing workflow while extending functionality?
INSIGHTS
These discussions clarified the priorities for the platform—preserving familiar workflows while introducing the right enhancements. We reviewed the proposed functionality in broad strokes, ensuring alignment with both business objectives and user expectations. With our key questions answered and consensus reached, we’re now ready to embark on Stage 2 of the Research & Discovery phase.
Stage 2: Competitor UX Benchmarking
Building on the user feedback document provided by the client, we performed a focused UX audit of their legacy survey platform to establish a baseline experience. Users had reported key limitations—poor offline support, no way to review or navigate back through submitted answers, and lack of visibility into which participants had already been surveyed.
At the same time, they appreciated aspects of the incumbent solution: it was quick to configure, and building surveys felt straightforward. Their top requests for improvement included the ability to review and edit completed responses, offer in-app feedback on survey questions, surface real-time statistics, and present a more intuitive, visually engaging interface.
In addition to cataloging these user-reported pain points, our design team conducted its own heuristic review—evaluating navigation patterns, information hierarchy, error handling, and visual consistency—to uncover further opportunities for improvement.
Insights
Our dual approach — combining direct user feedback with an independent design audit — made it clear which elements to carry forward and which to overhaul. These findings have directly shaped our feature roadmap, ensuring the refreshed platform delivers both the familiar ease of use users expect and the robust capabilities they need.
Stage 3: Needs Matrix
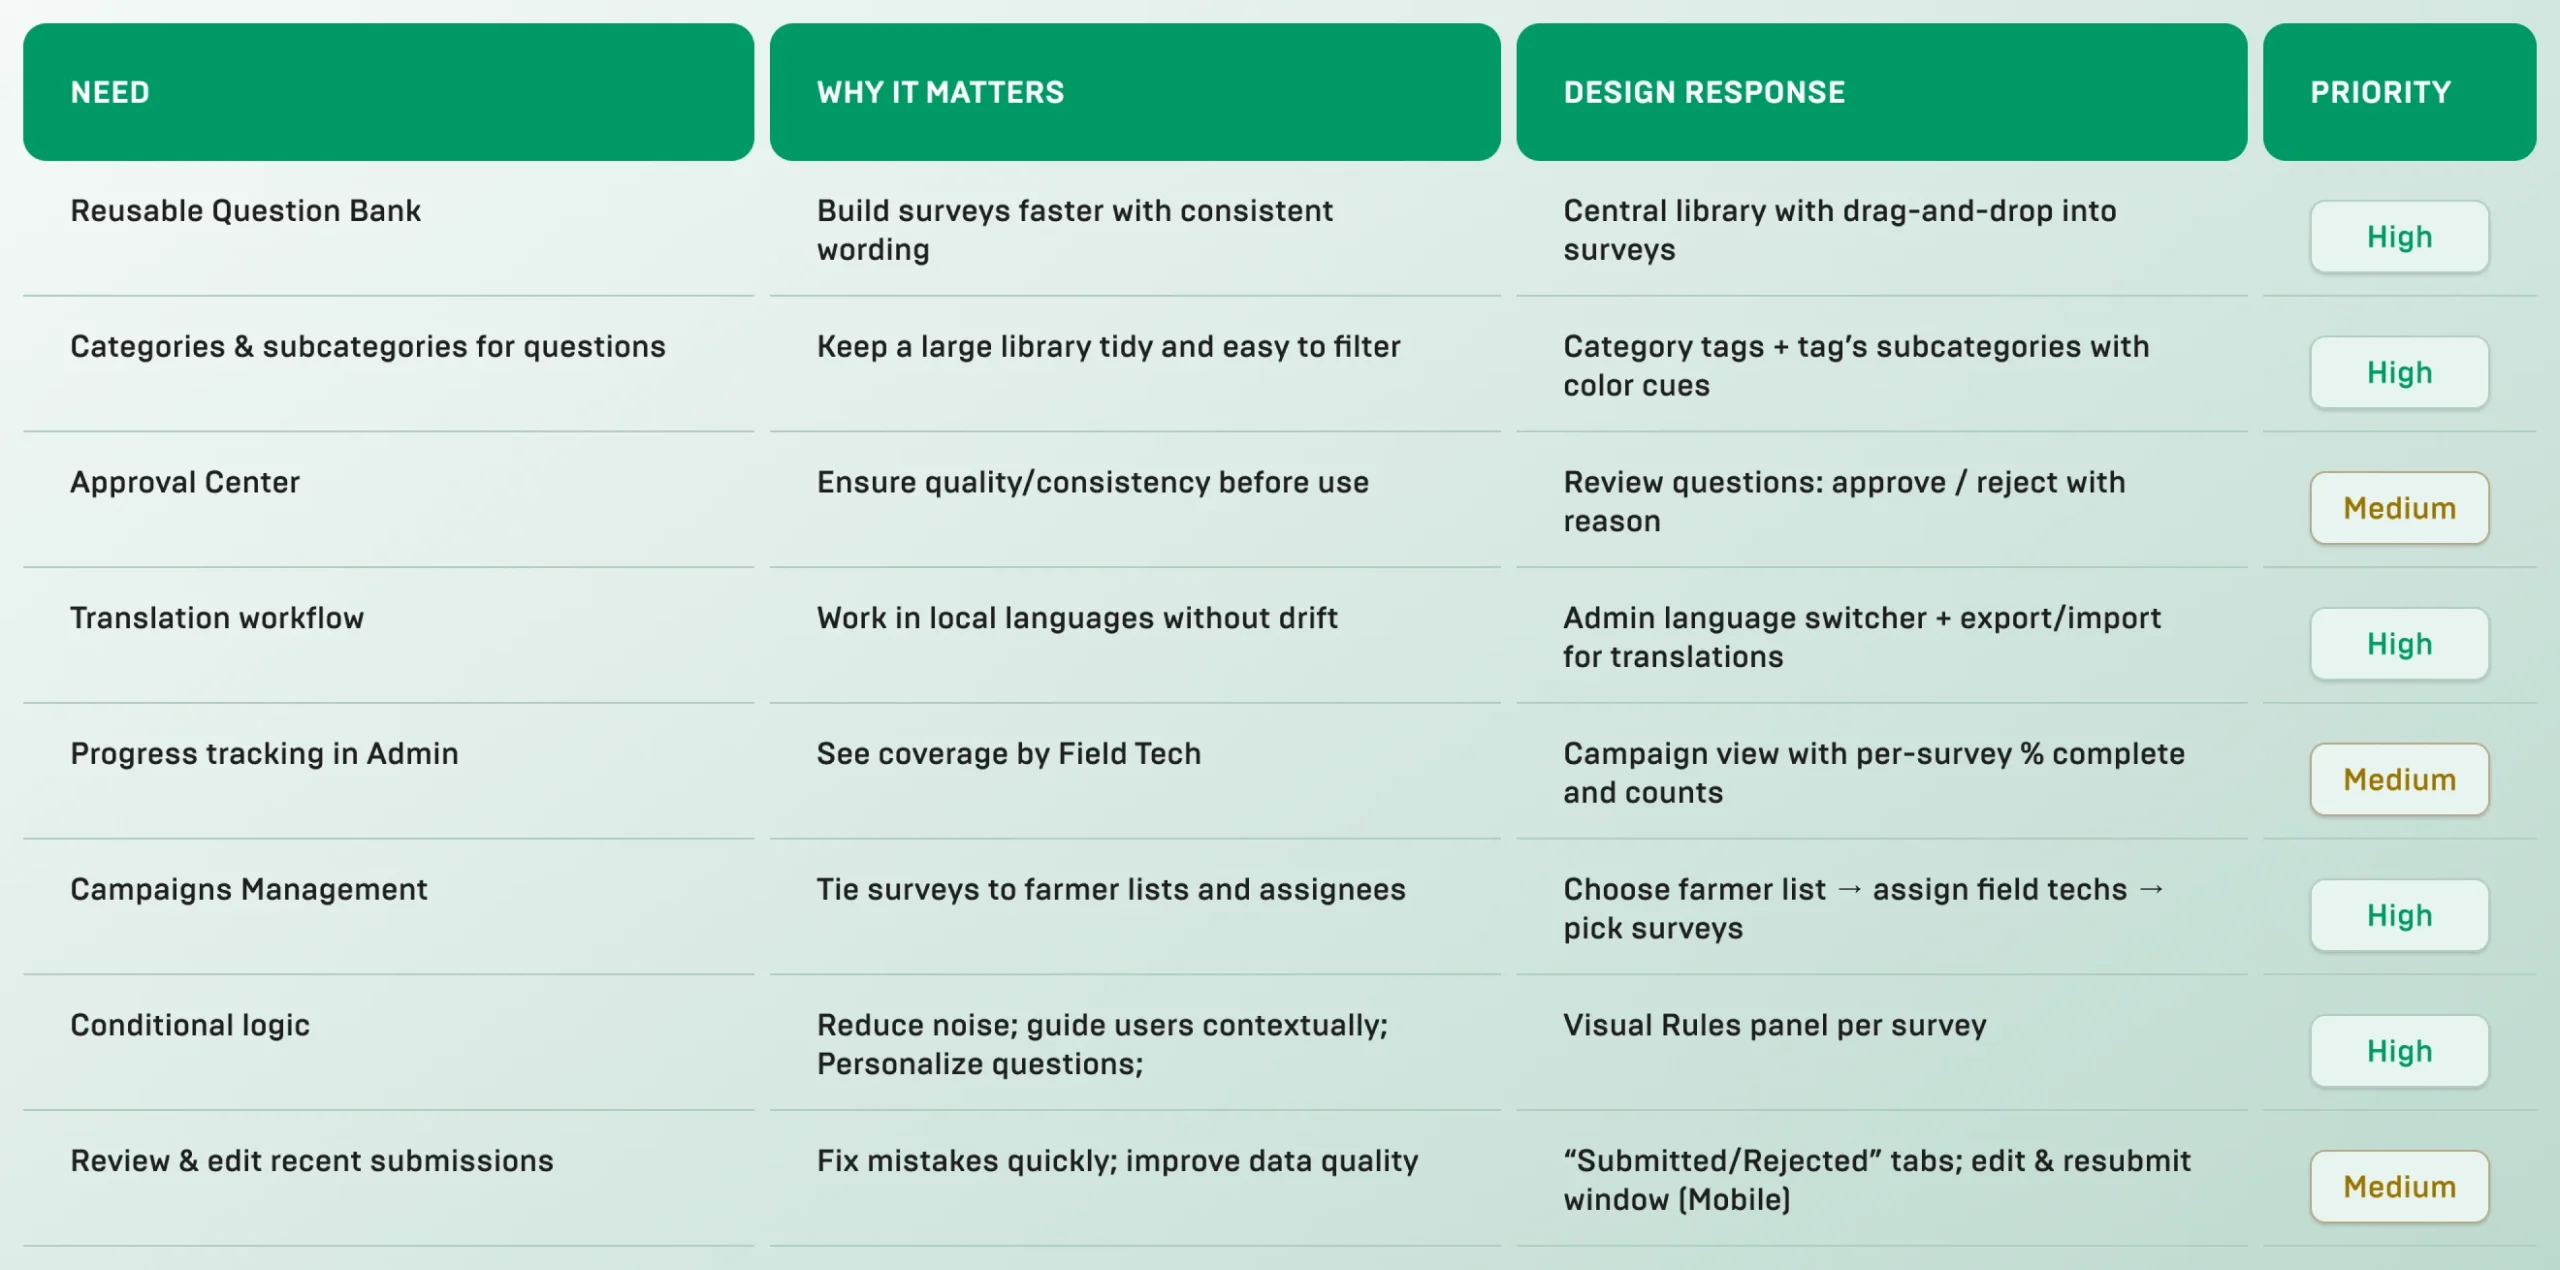
Based on our stakeholder interview and UX benchmarking, we synthesized all findings into a concise needs matrix. This matrix maps each core requirement to its origin (user feedback, design audit, client’s & business request), its priority level, and the feature or design decision that fulfills it.
This needs matrix ensures that every design decision directly addresses a documented requirement—whether it came from end-user pain points, our own heuristic review, or high-level business objectives. It serves as the blueprint for our design and development roadmap moving into the next stage.
Stage 4: Information Architecture
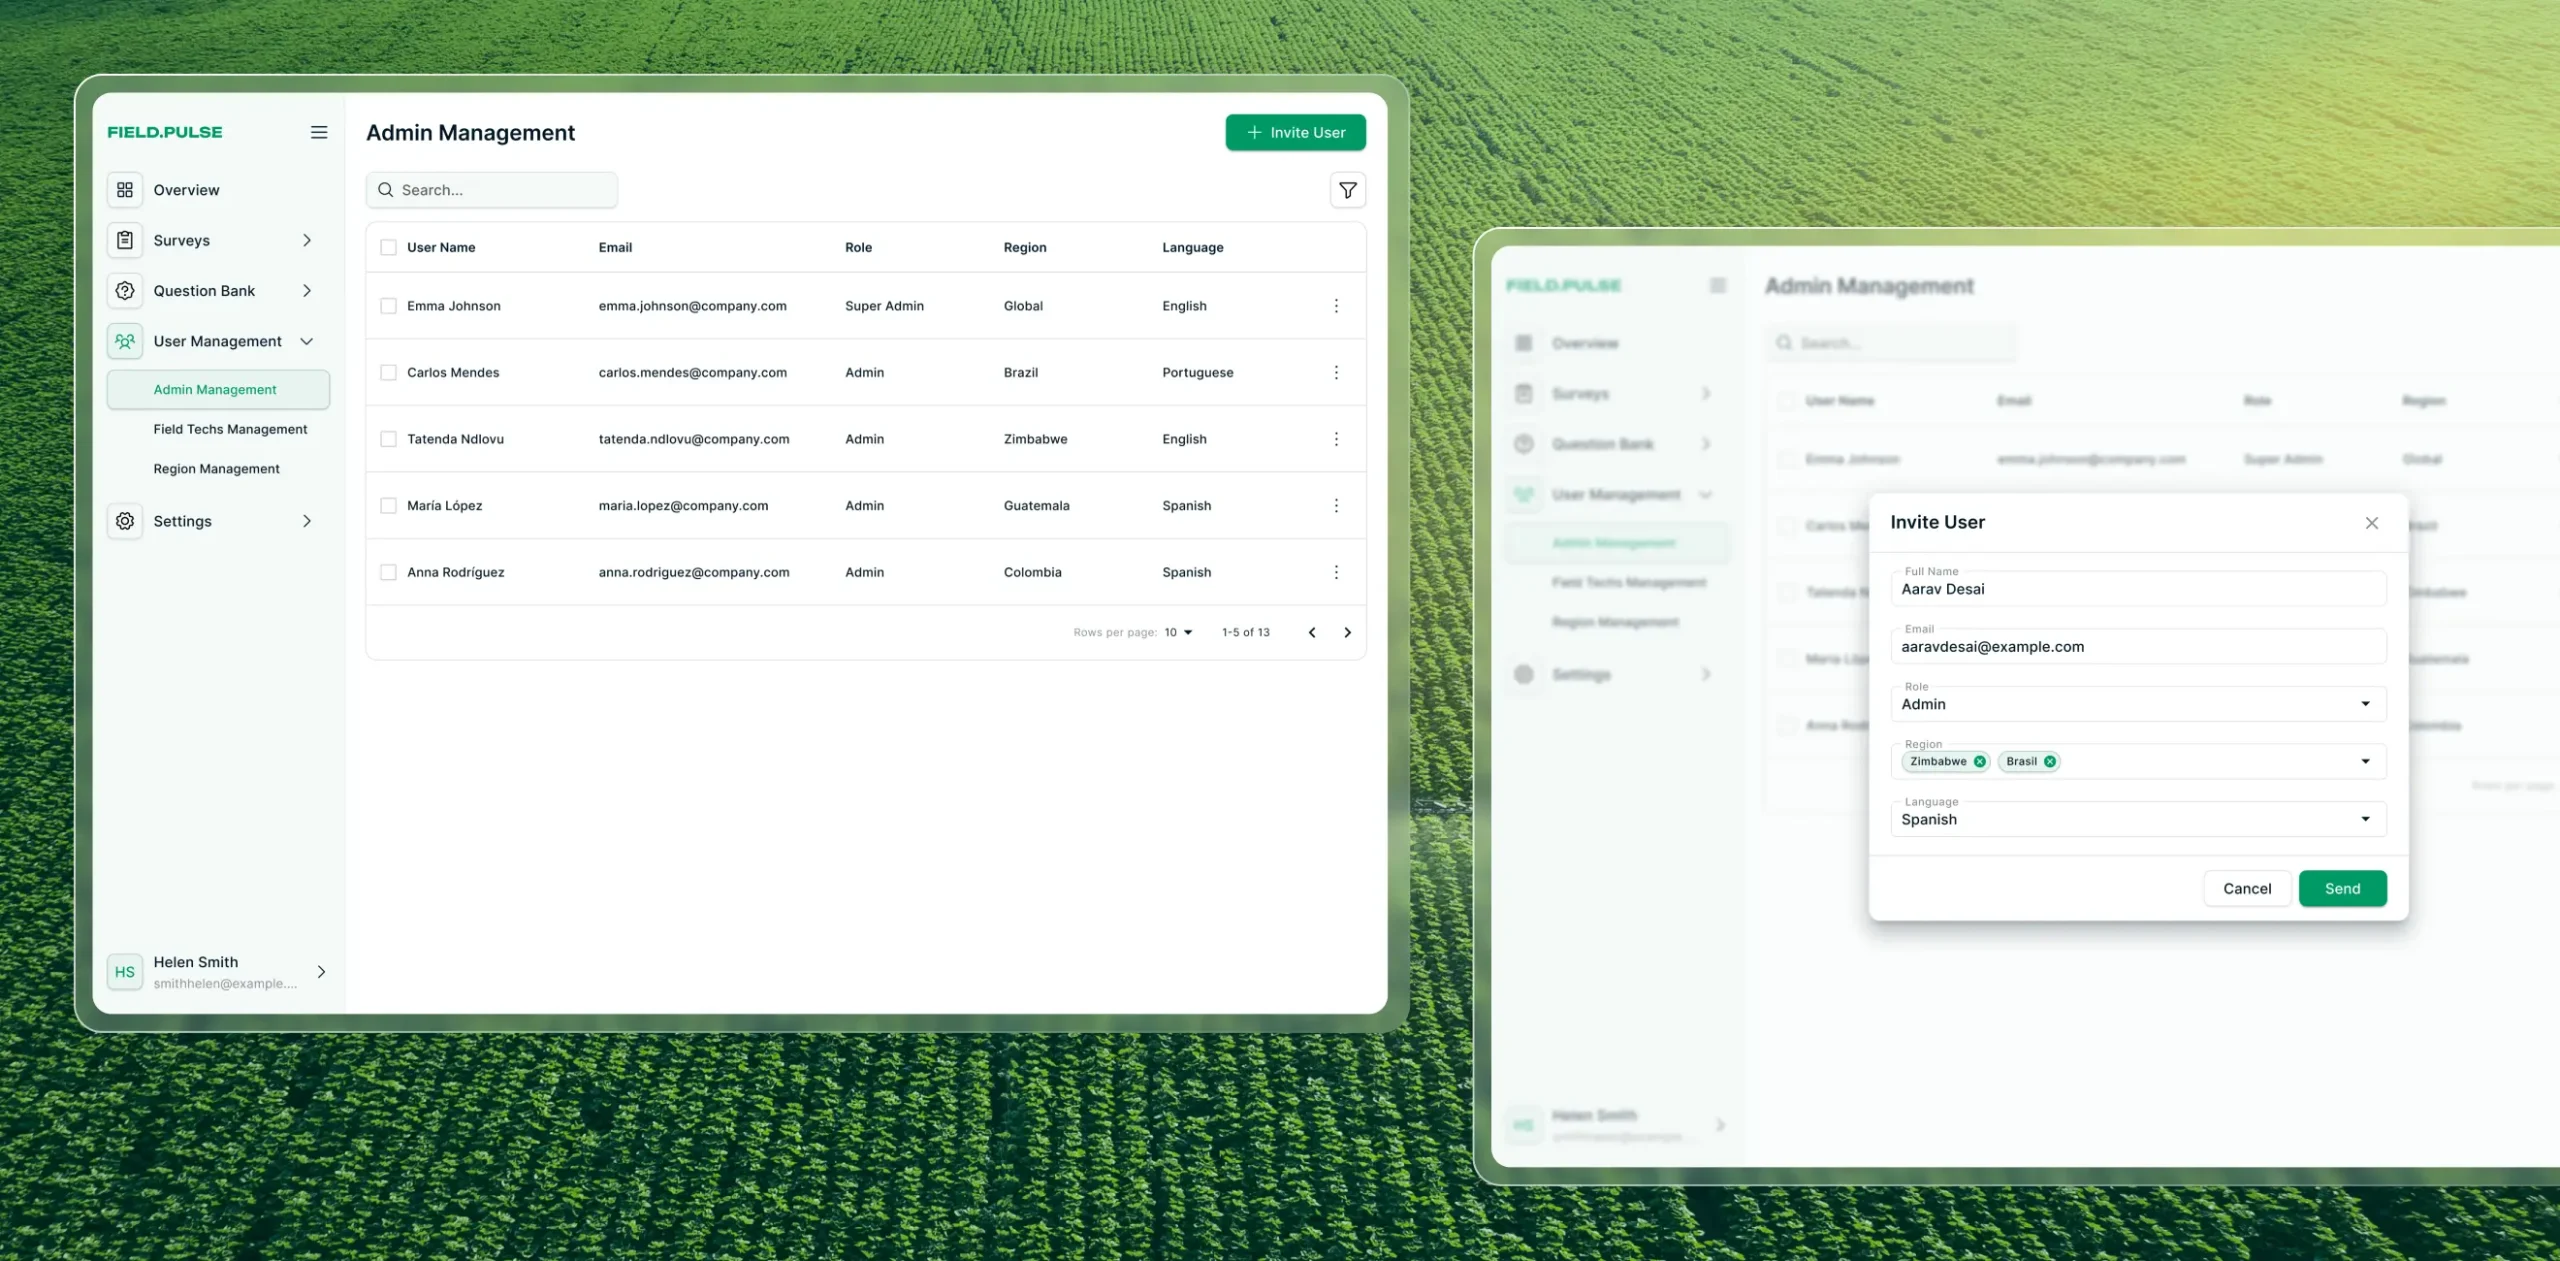
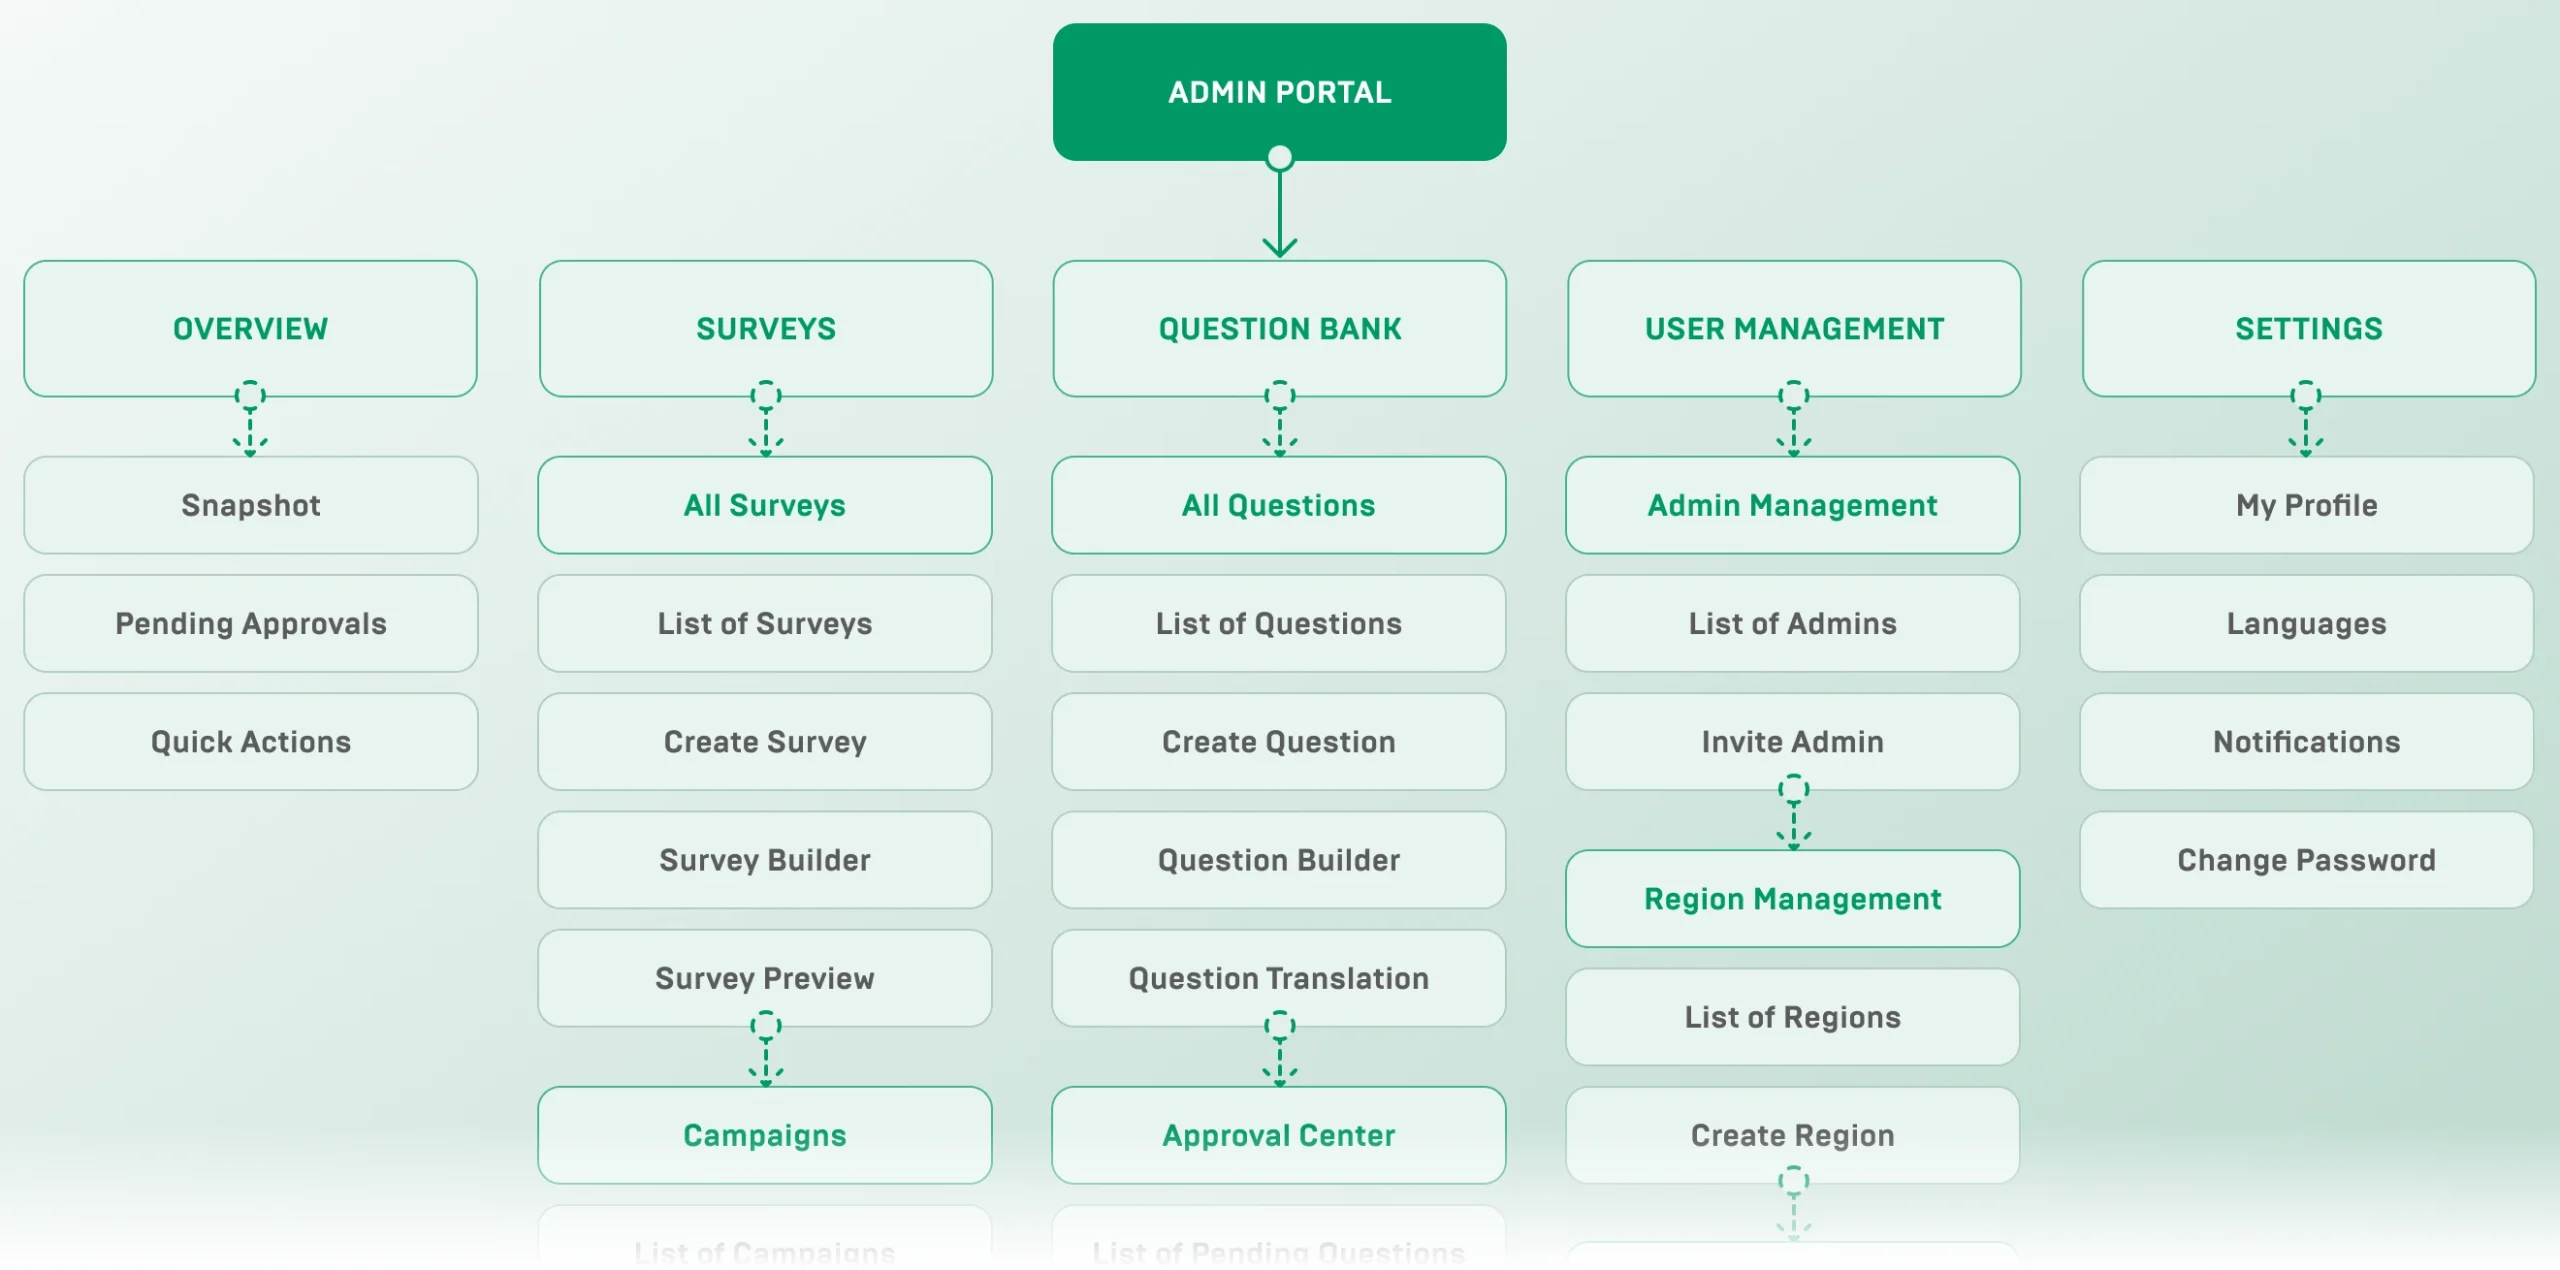
With a clear understanding of user needs and design priorities, we crafted the Information Architecture to organize the platform’s functionality into logical, role-based modules. At the top level, the Admin Portal is divided into five core areas — Overview, Surveys, Question Bank, User Management, and Settings — each accessible via a persistent sidebar.
For the Mobile App, we simplified the IA to focus on field workflows: Campaign List, Survey Tasks, Farmer Selector, and Offline Sync. Common components (navigation bar, progress indicator, settings) remain consistent across both web and mobile, reinforcing a cohesive experience.
This IA blueprint guided our wireframes and prototypes, providing a clear map for developers and stakeholders alike.
Design
Wireframing & prototyping
In the wireframing phase, we sketched out the core screens for both the Admin Portal and the Mobile App — defining layouts for the Question Bank, Survey Builder, Campaigns, the Field Technician’s survey flow etc. These wireframes were specifically designed to validate and refine the underlying logic of new features — such as the reusable Question Bank — ensuring each workflow functioned correctly before moving into high-fidelity design.
We then translated these into clickable prototypes and presented them to our client’s focus group of end-users. Their hands-on feedback led to quick revisions on component placement, button labels, and form validation, ensuring our designs not only met business needs but also felt intuitive and familiar to existing users.
Design
User interface design
We delivered a clean, simple UI that follows the idea that great design is minimal. Built on the MUI component library for consistency and quick development, each screen uses a neutral color scheme and ample white space to lessen cognitive load. When unique workflows required it — like the Survey Builder or Question Builder—we designed custom components that blend smoothly with the MUI system.
Every button, form field, and navigation element follows a clear 8-point grid, ensuring visual harmony across both web and mobile. The end result is an interface that feels familiar, performs intuitively, and keeps users focused on their tasks rather than the tool itself.
Deliverables
Key Features Developed
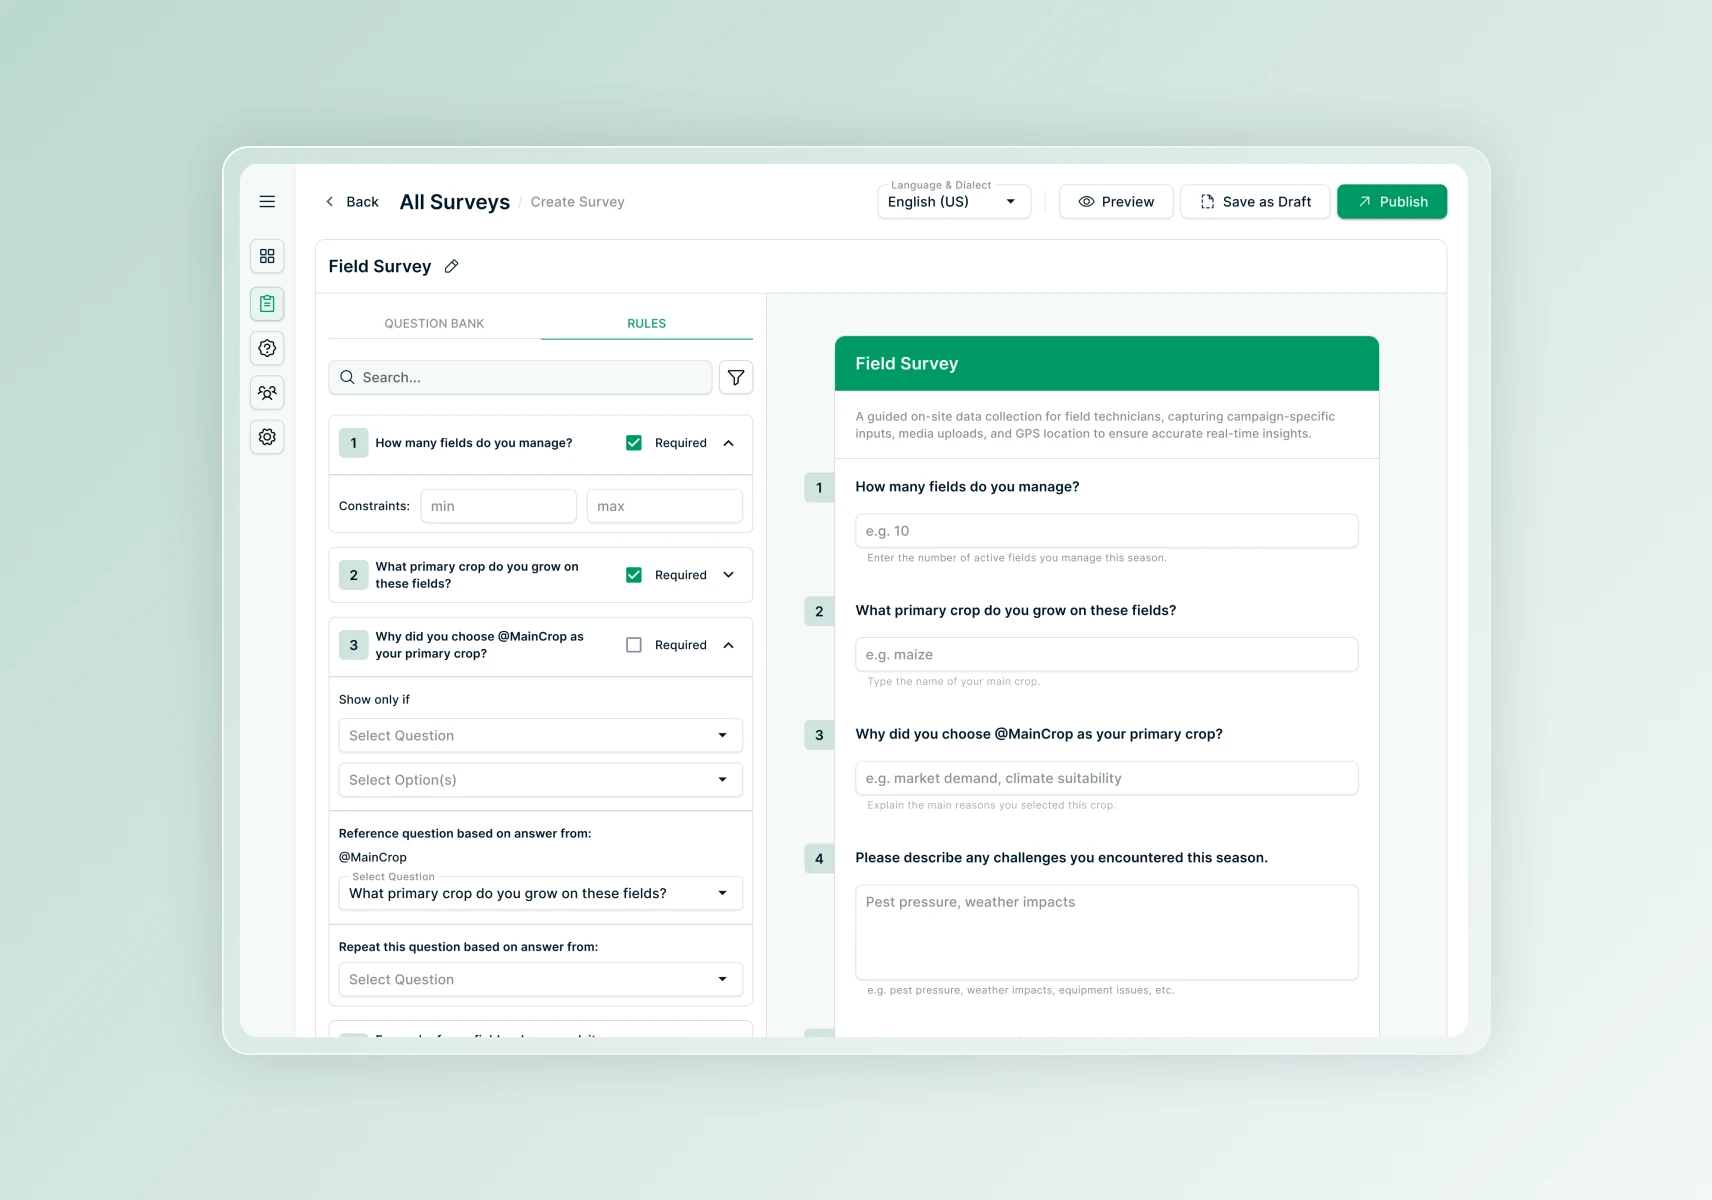
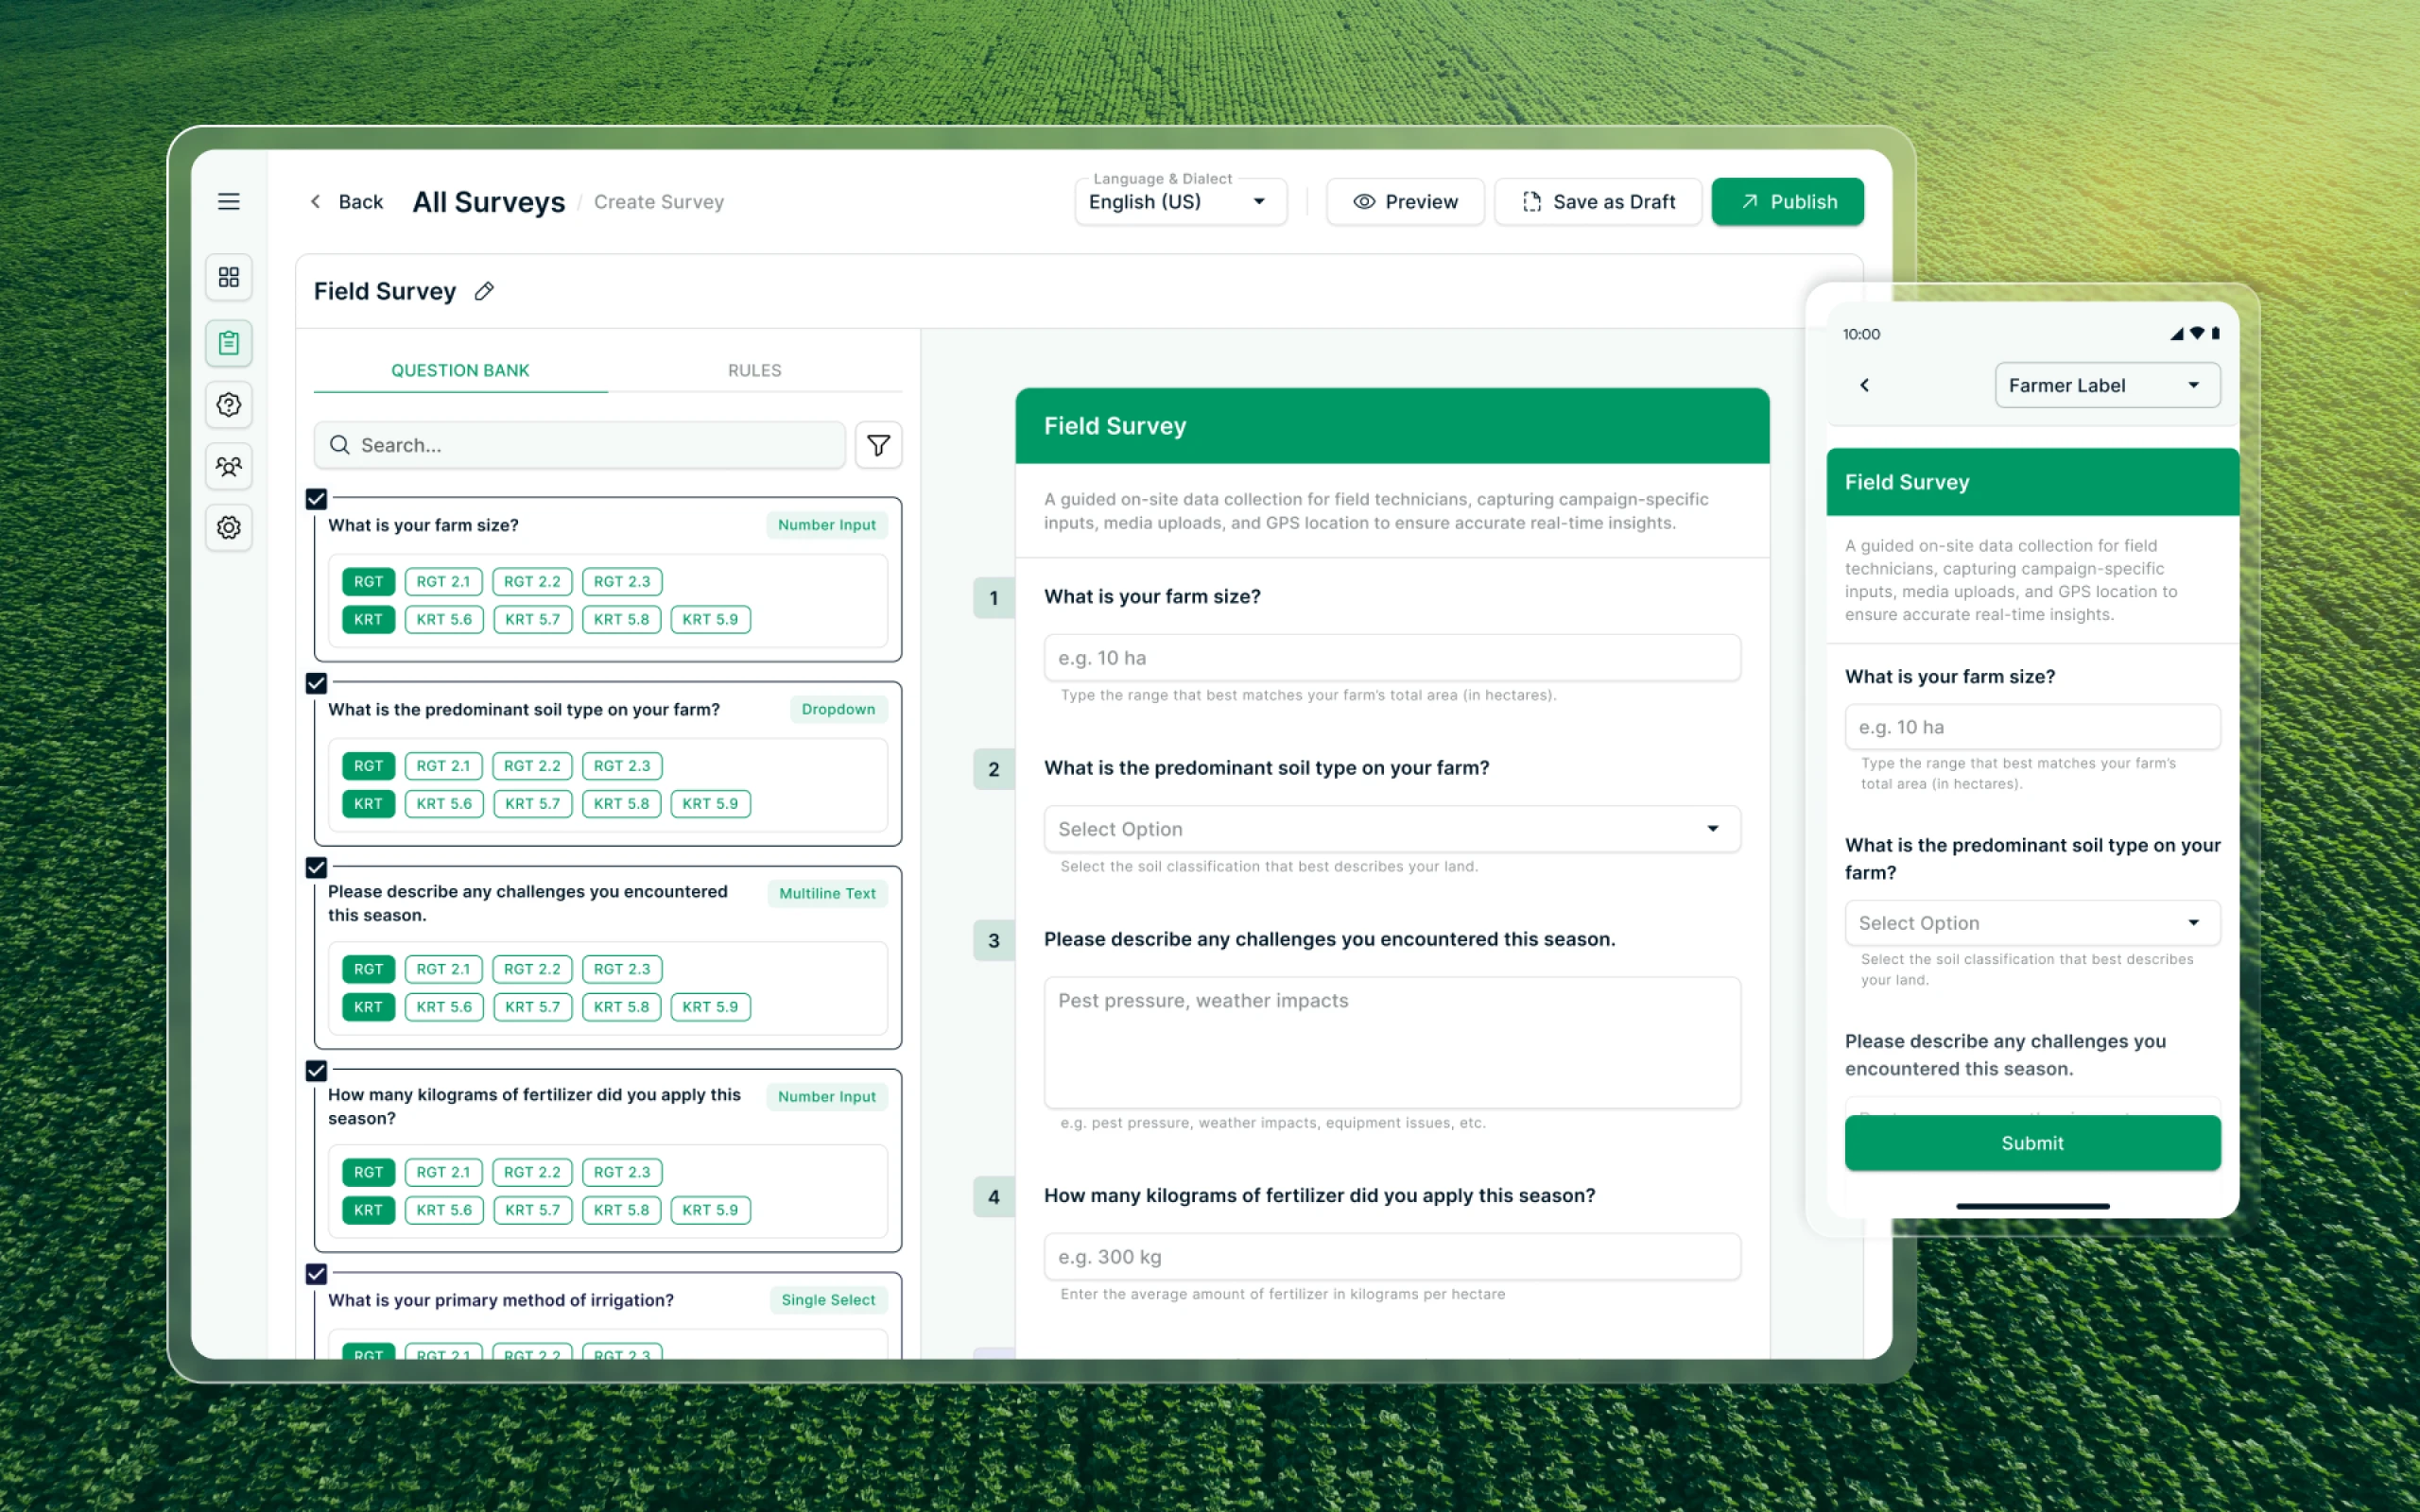
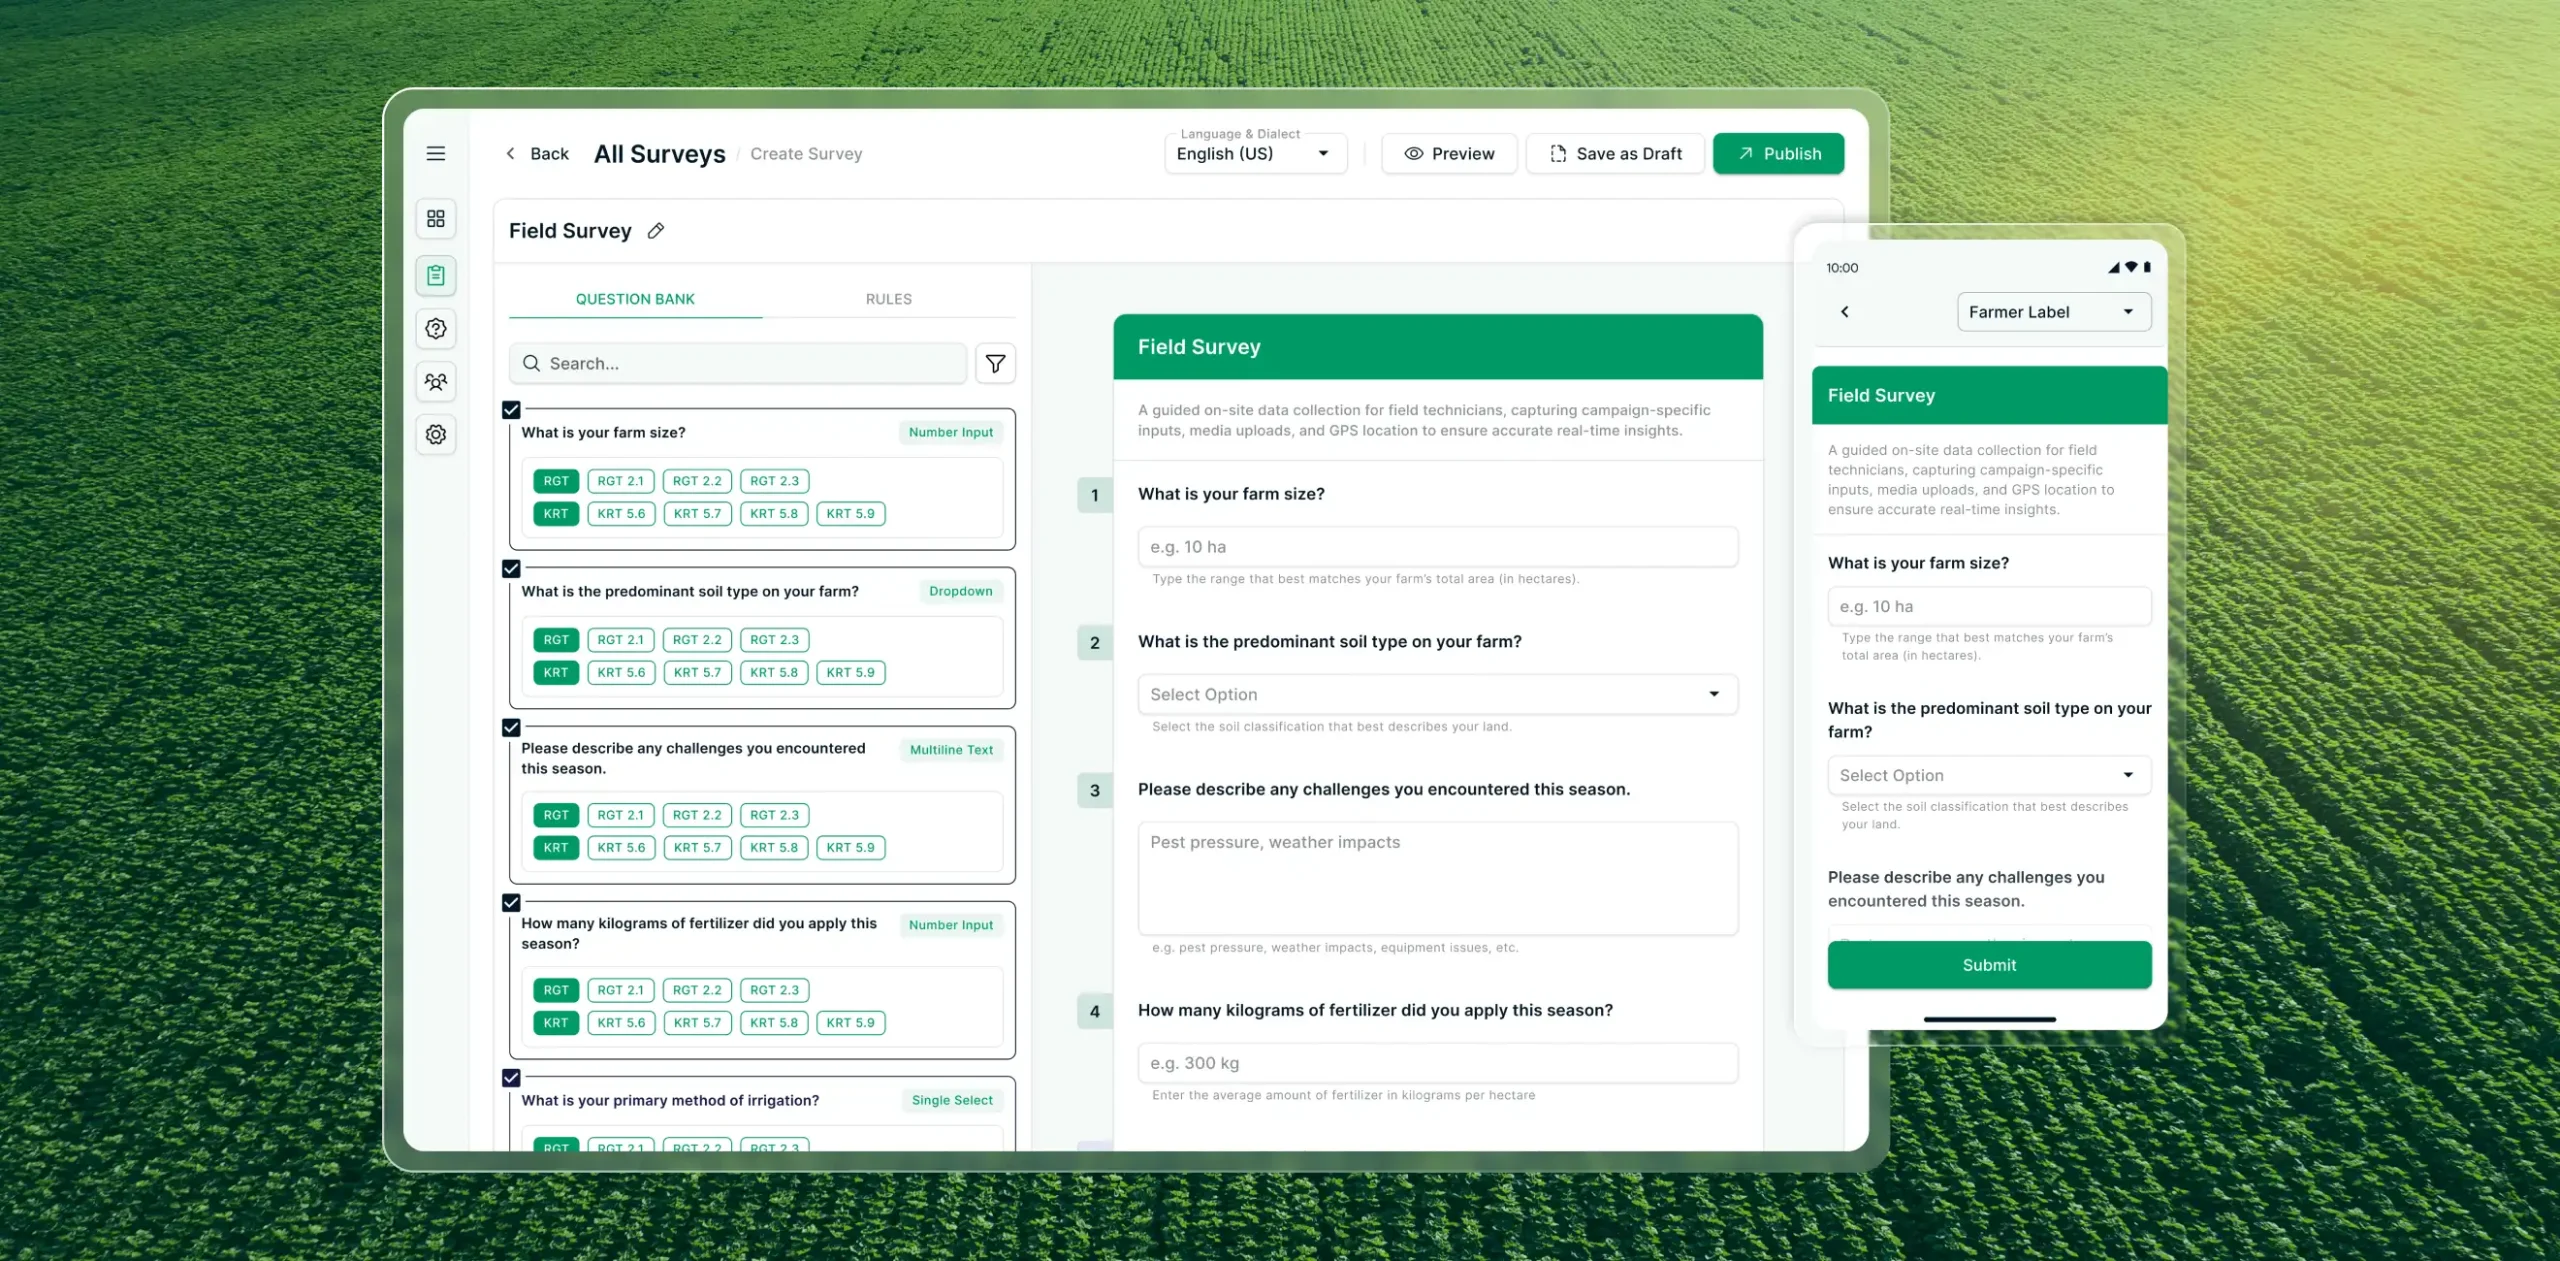
SURVEY BUILDER
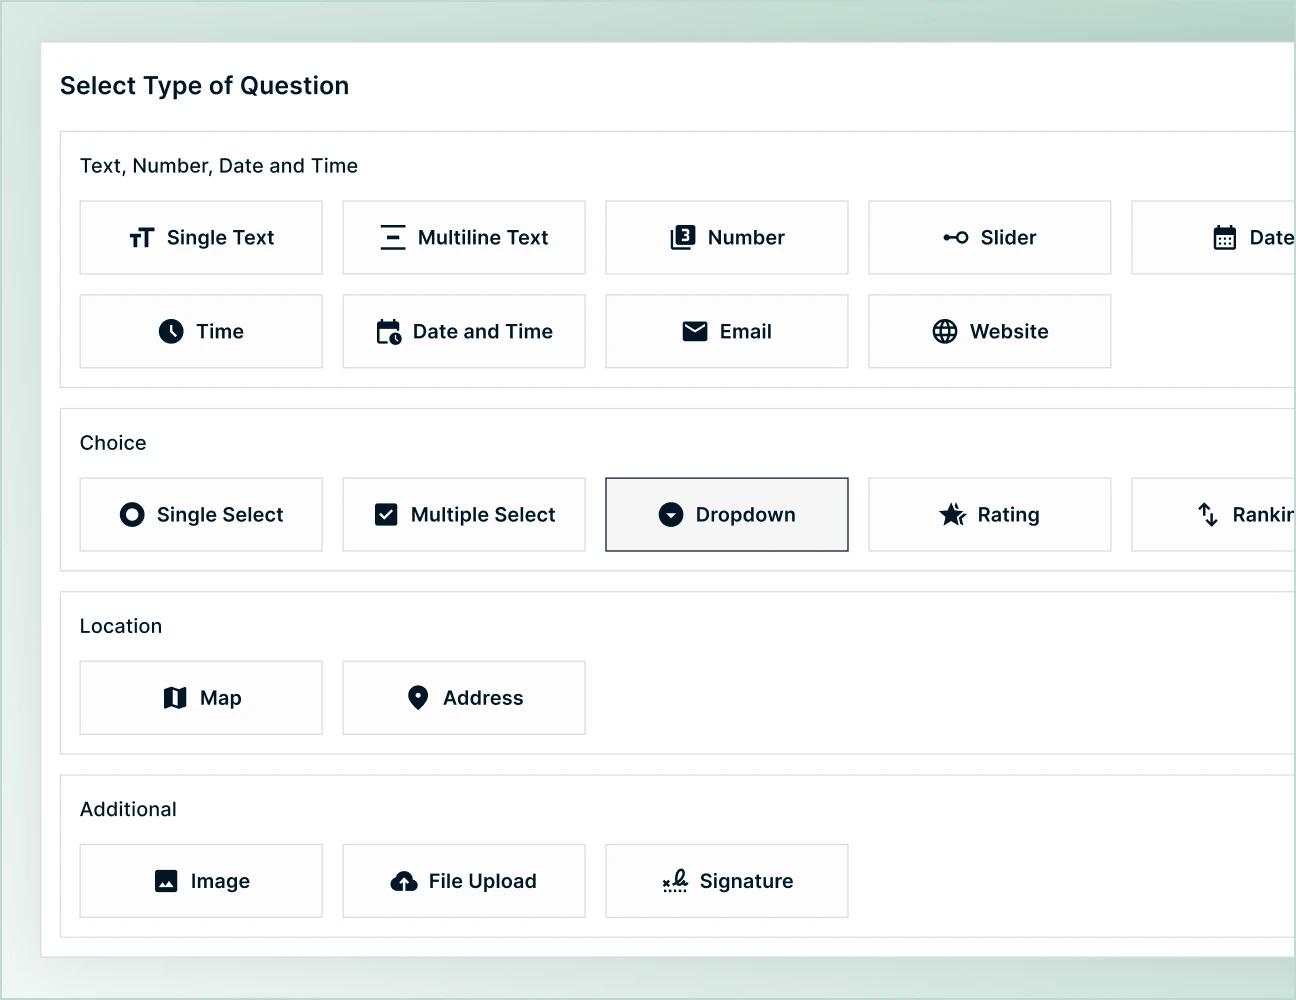
An intuitive drag-and-drop interface that lets administrators assemble surveys from the Question Bank, configure conditional logic, and set up dynamic behaviors with just a few clicks.
It supports a wide range of question types — including number inputs, map-based location selectors, dropdowns, date pickers, and more—to capture any kind of field data.
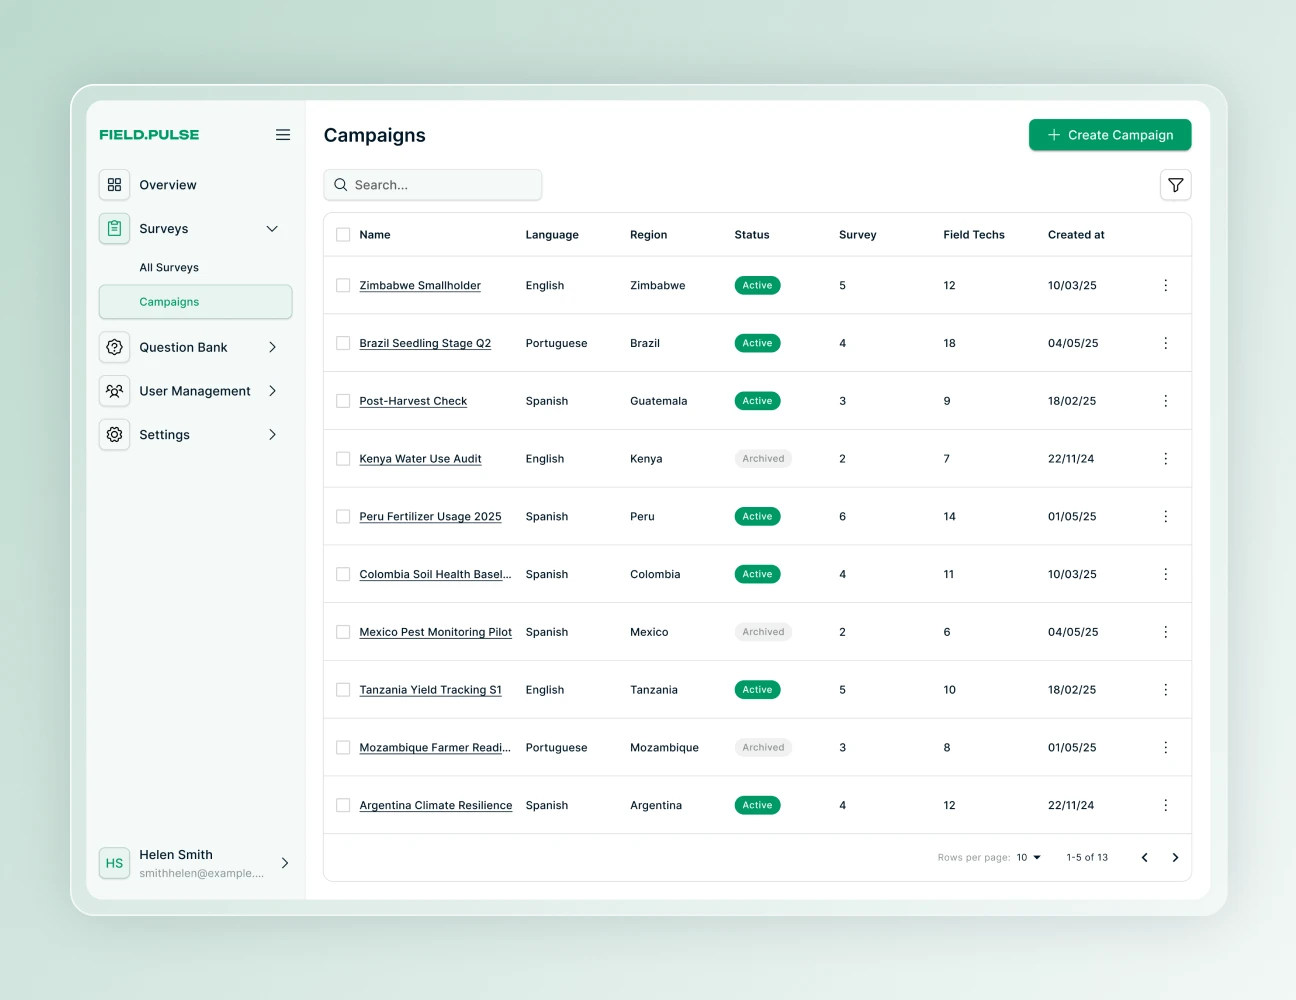
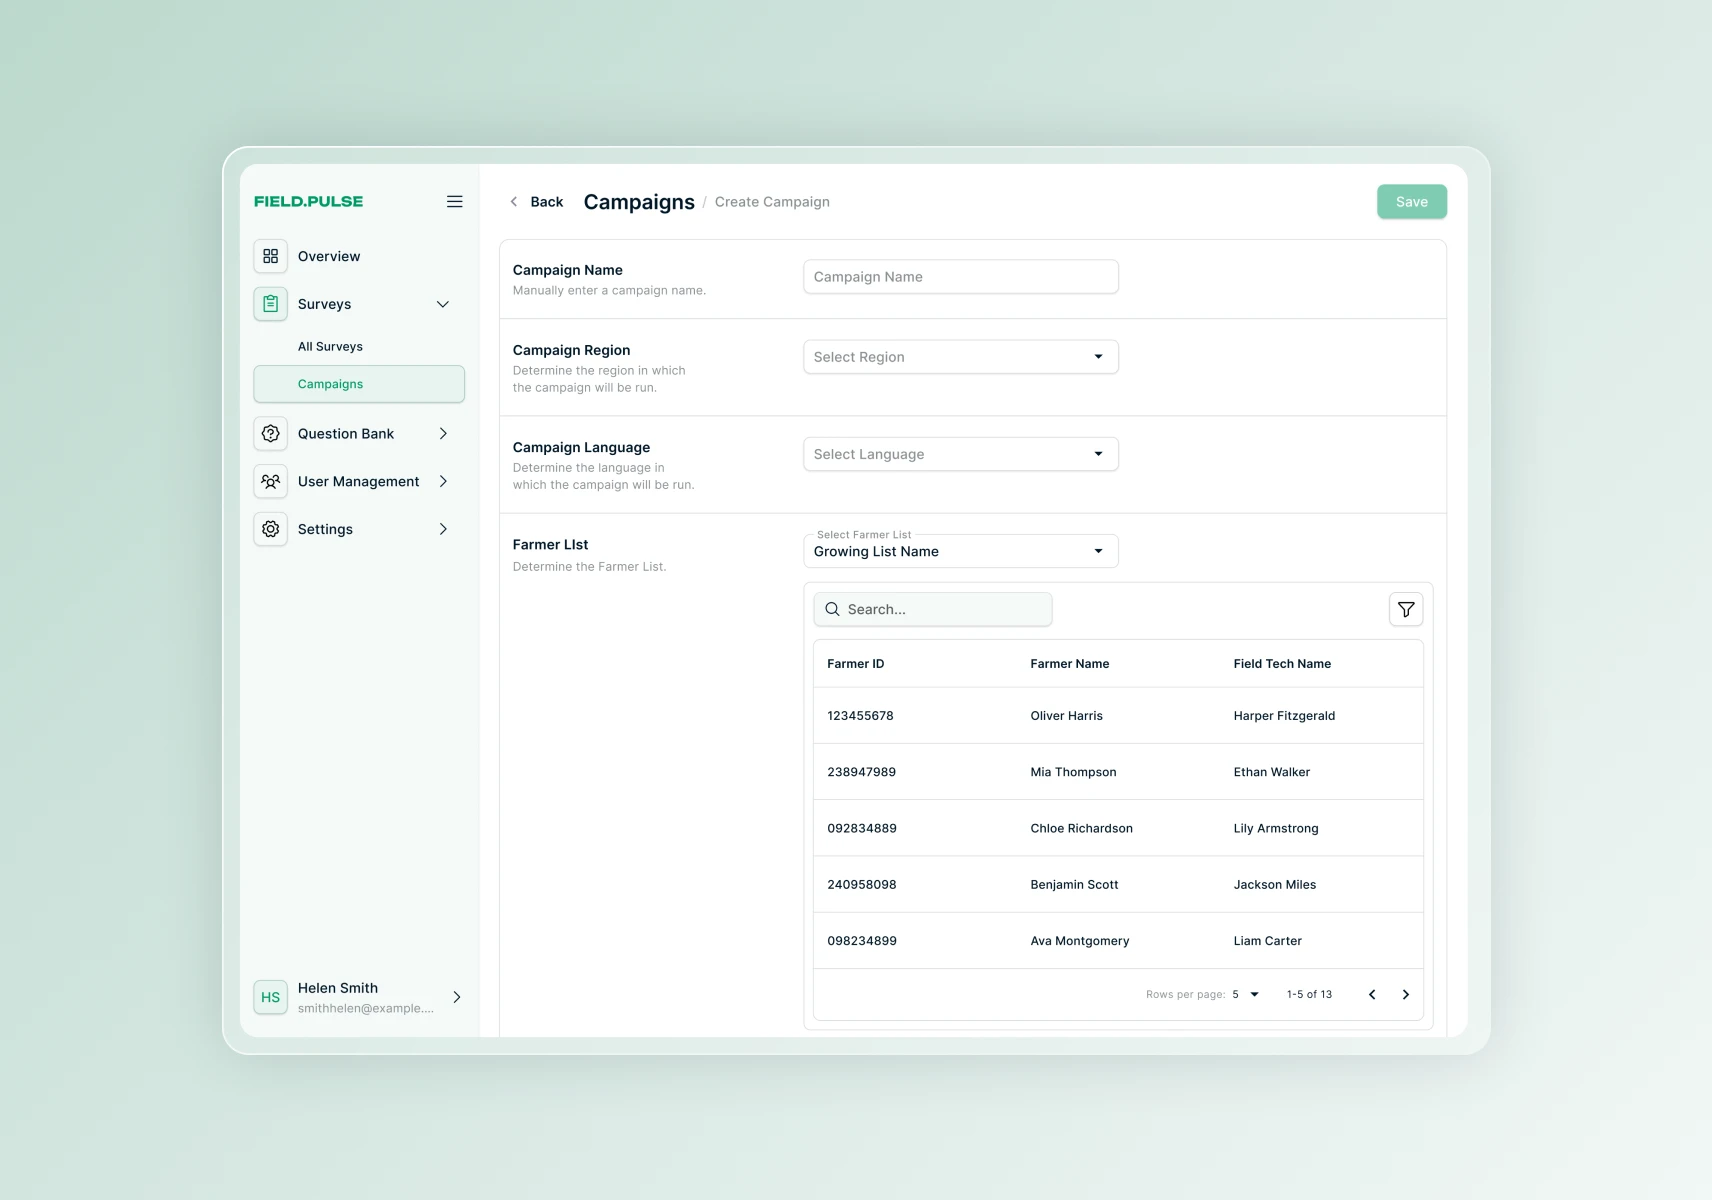
CAMPAIGNS MANAGEMENT
A straightforward interface for creating campaigns: choose a farmer list, assign field technicians, and select which surveys to include. Once a campaign is live, admins can return to the same view to track survey progress—seeing how many farmers each technician has completed.
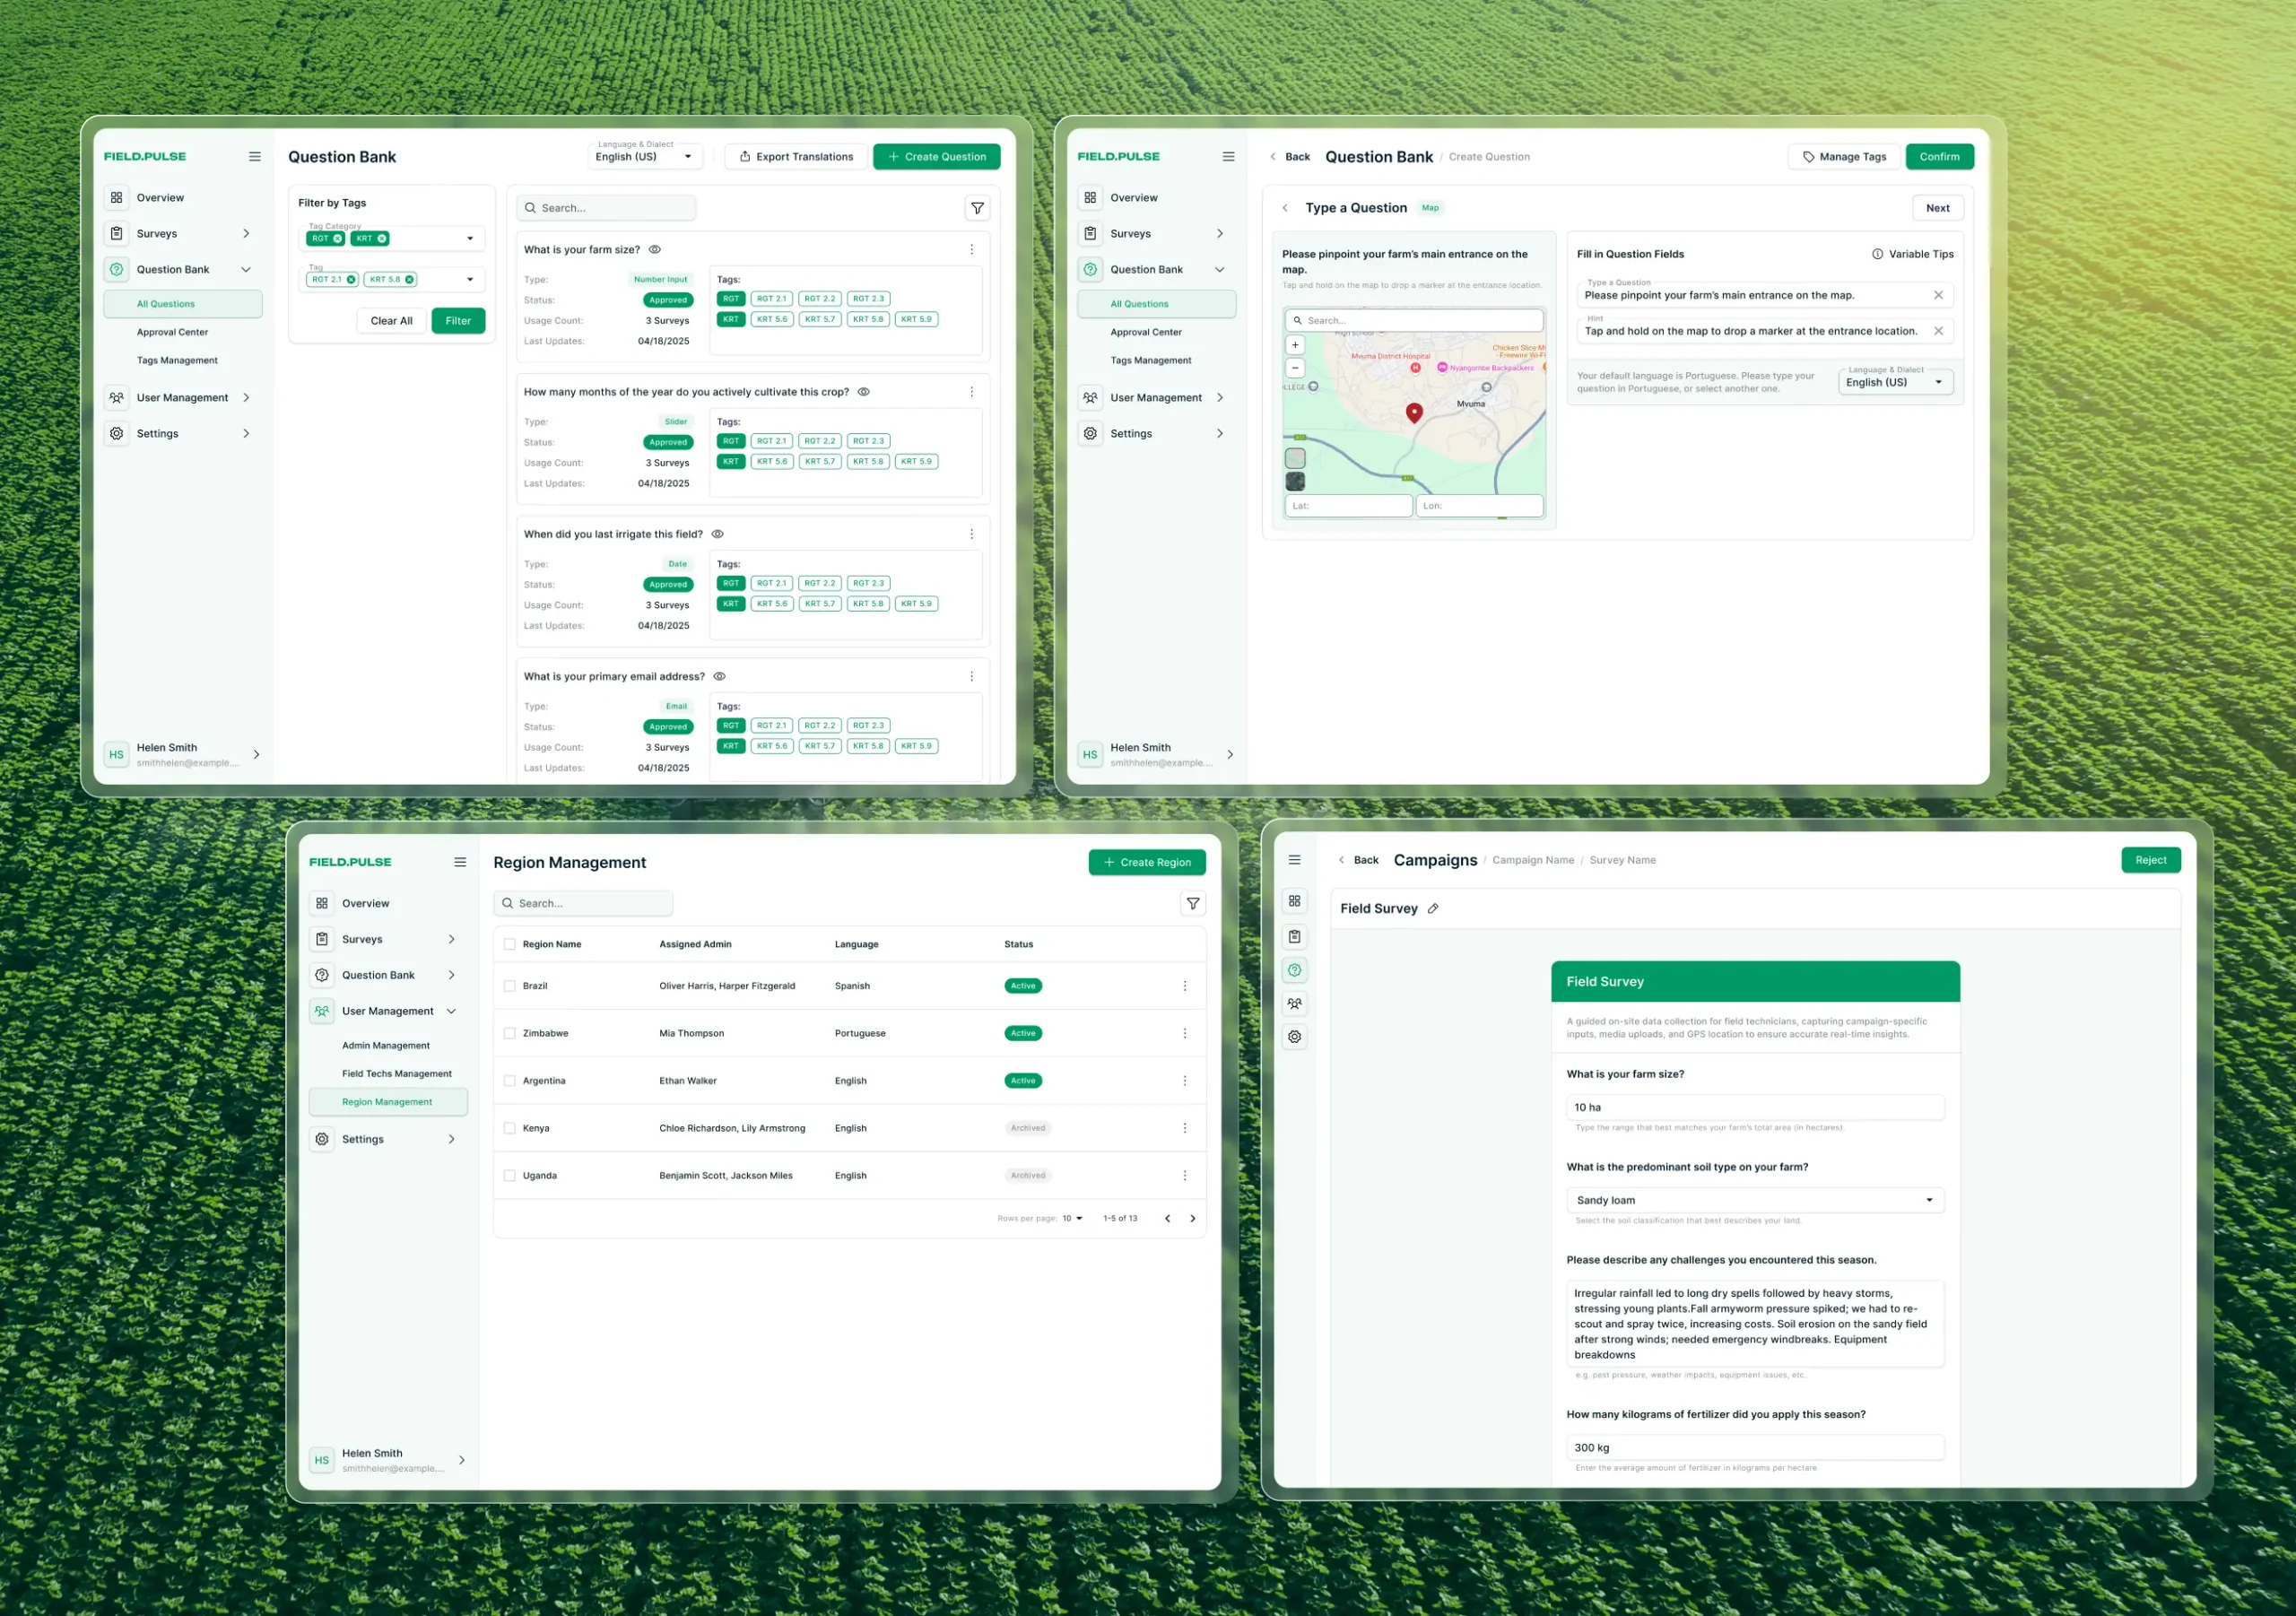
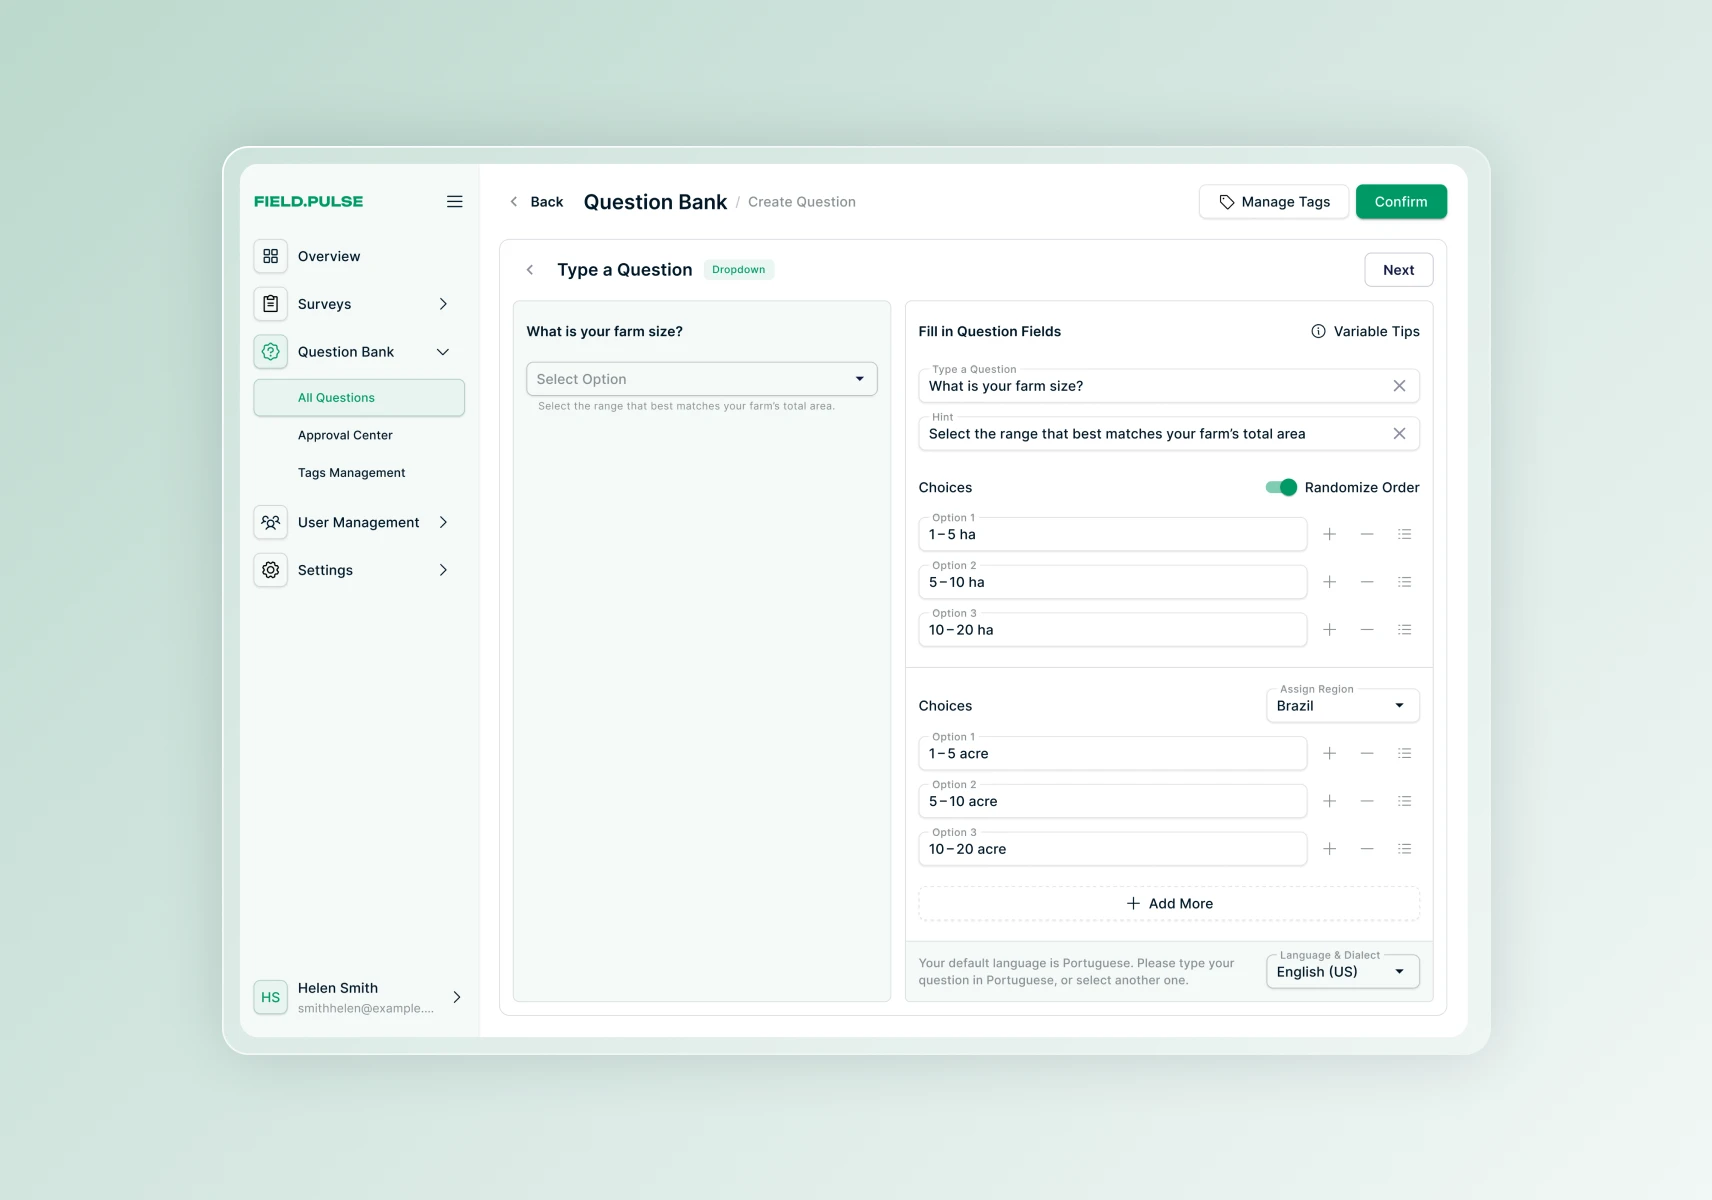
QUESTION BANK & BUILDER
A central library of reusable questions, each with metadata tags and multi-language support. Admins can categorize, send for approval, and manage translations, then drag questions directly into surveys. This ensures consistency across campaigns and speeds up survey creation by leveraging pre-built, standardized question components.
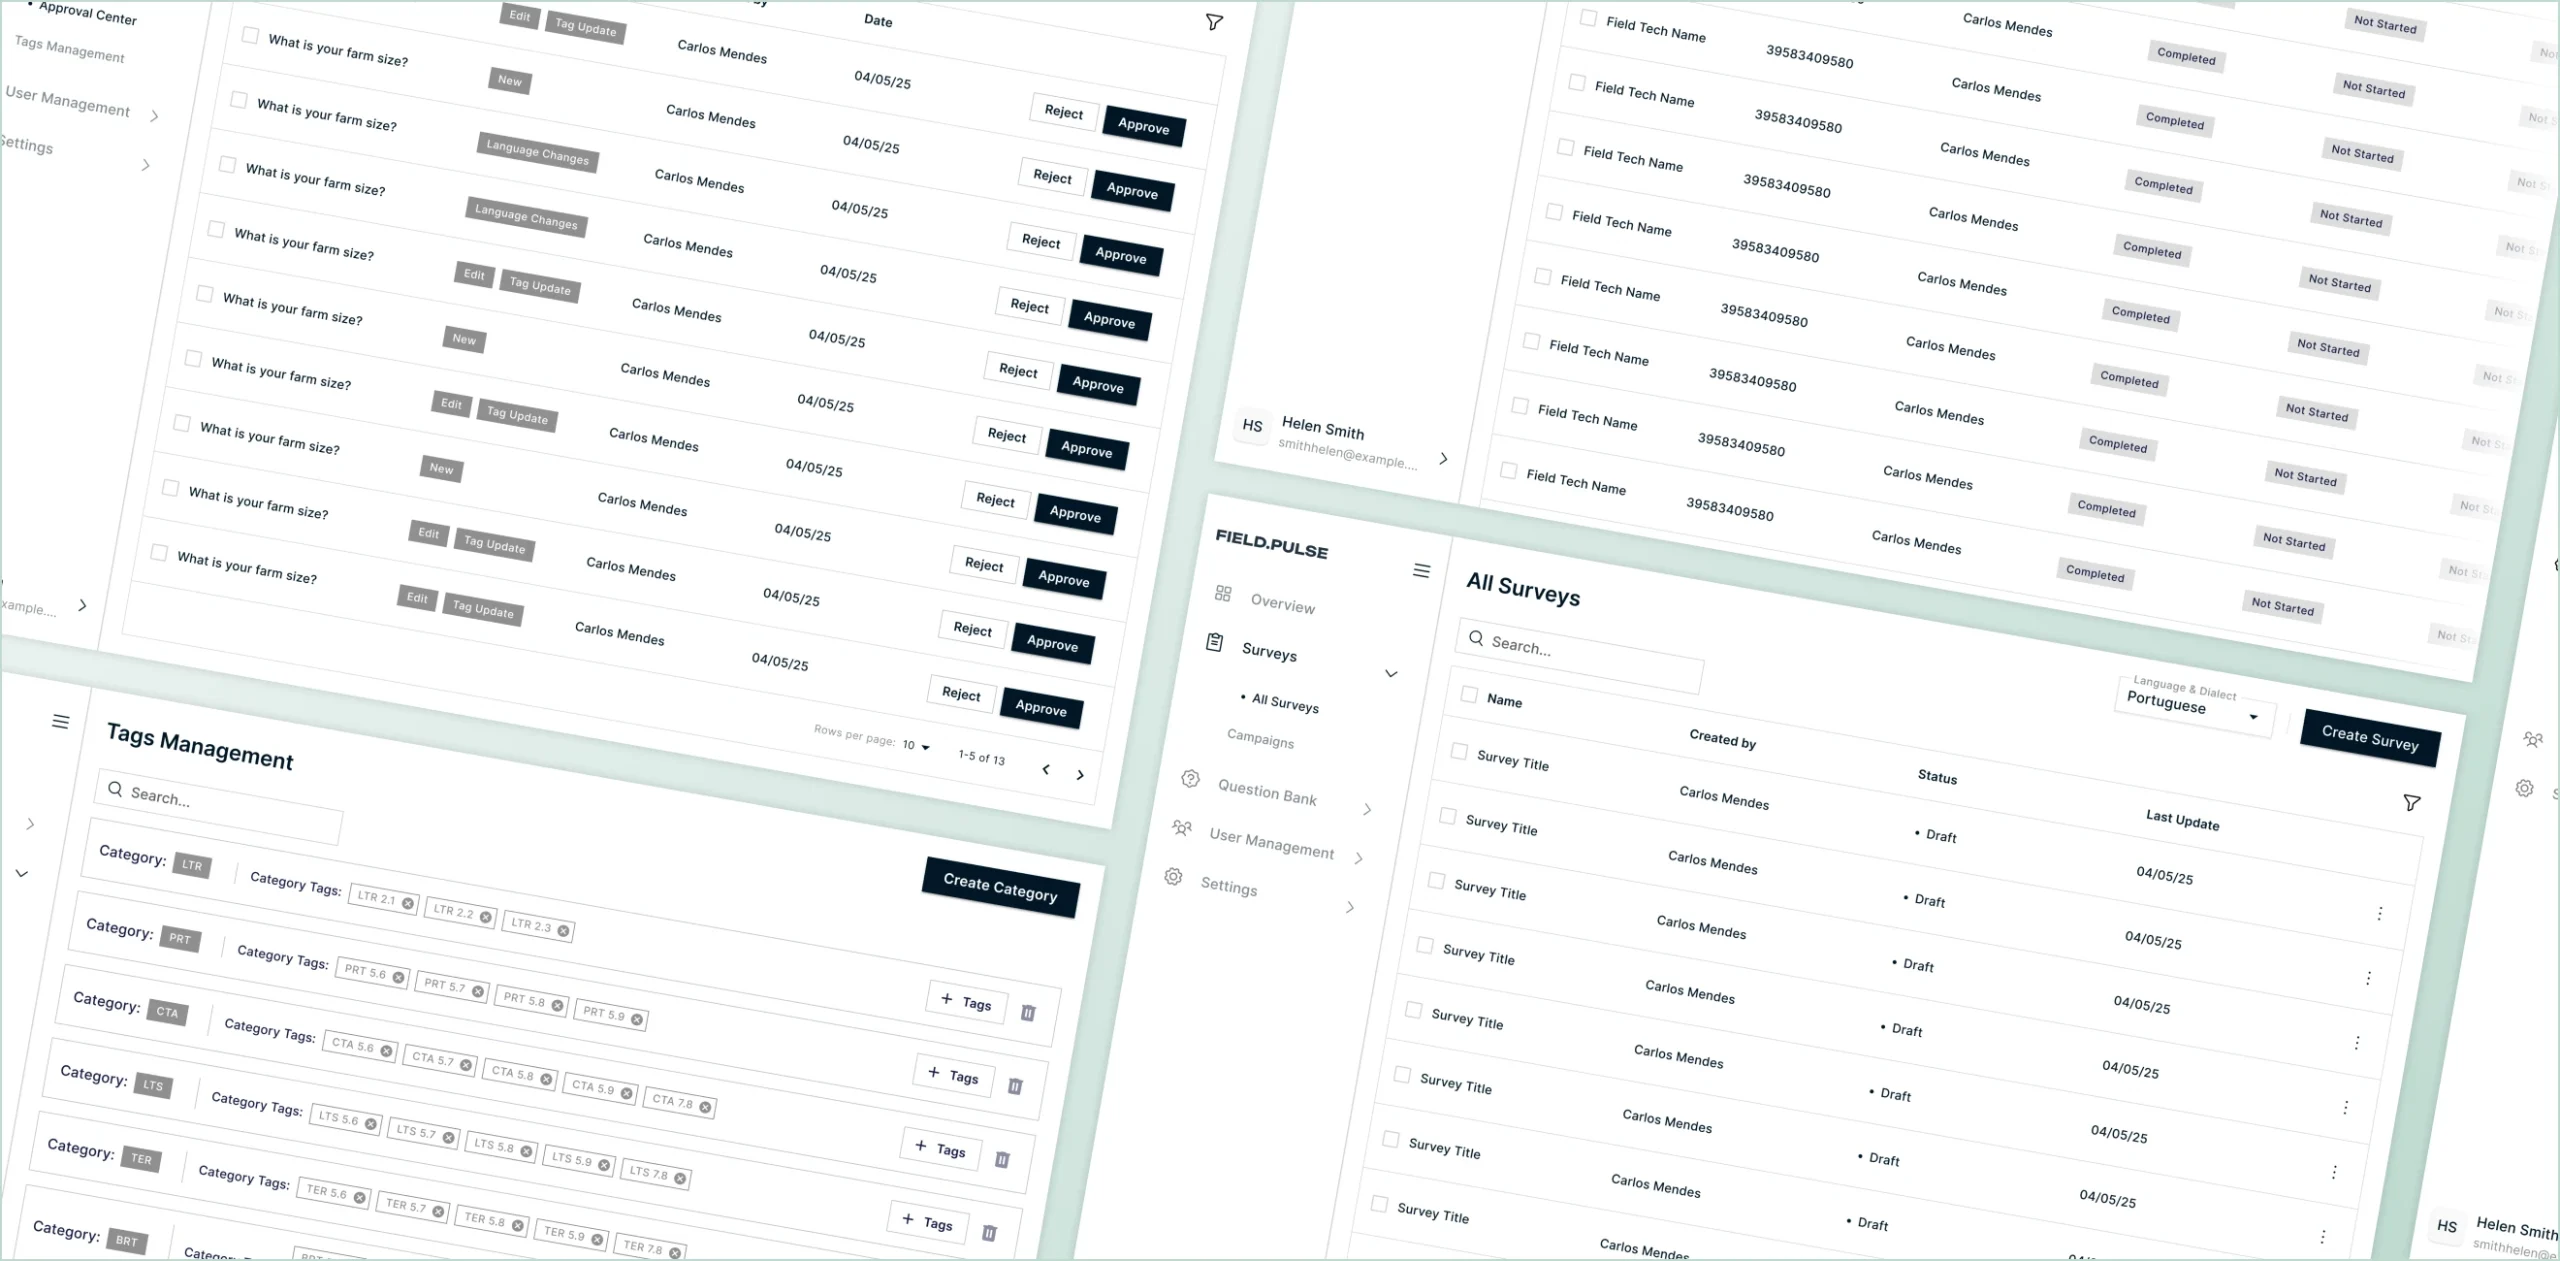
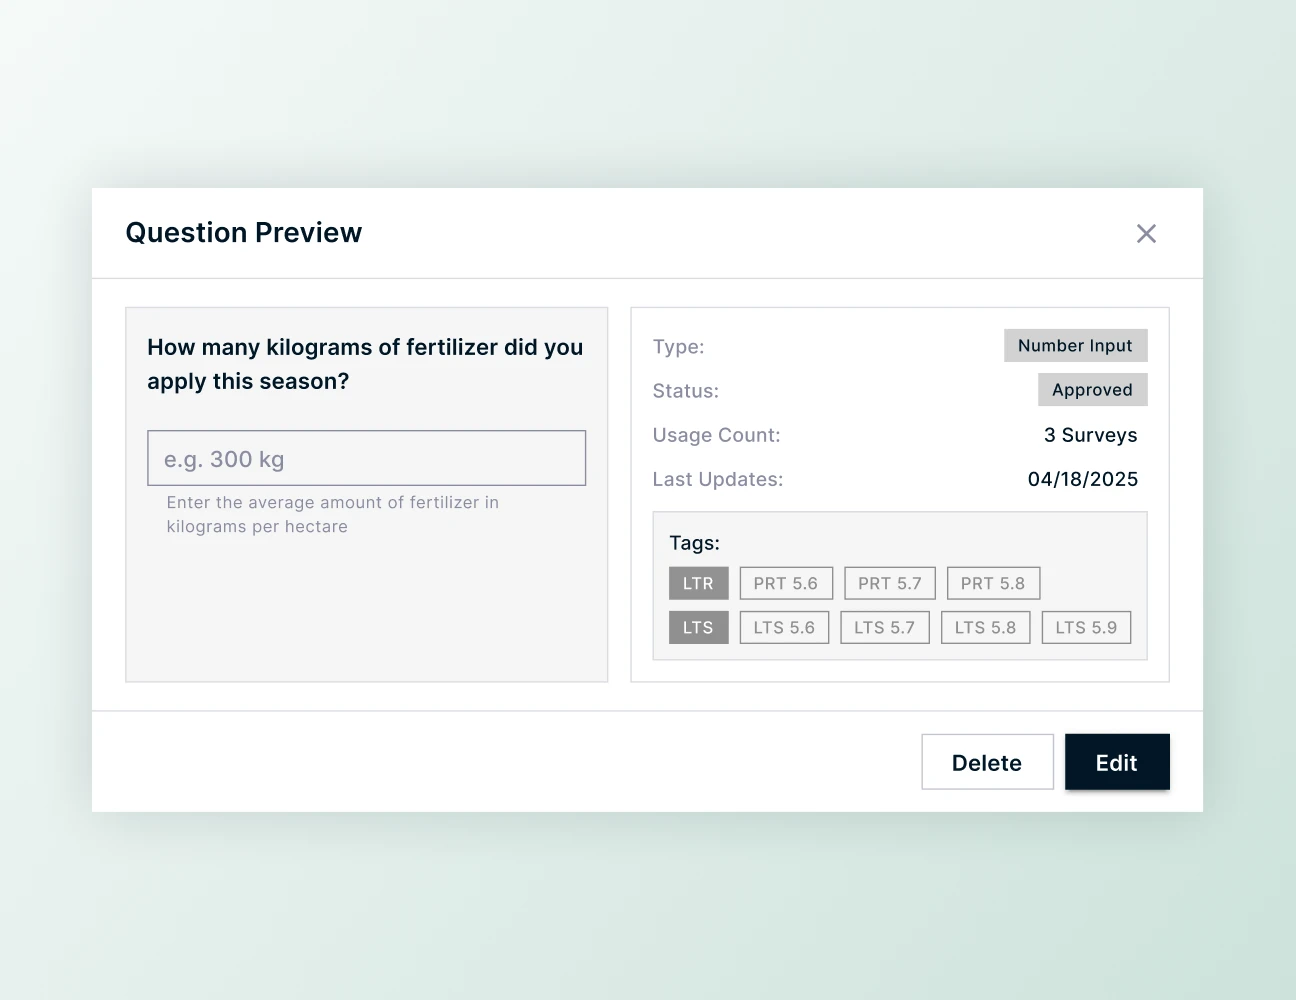
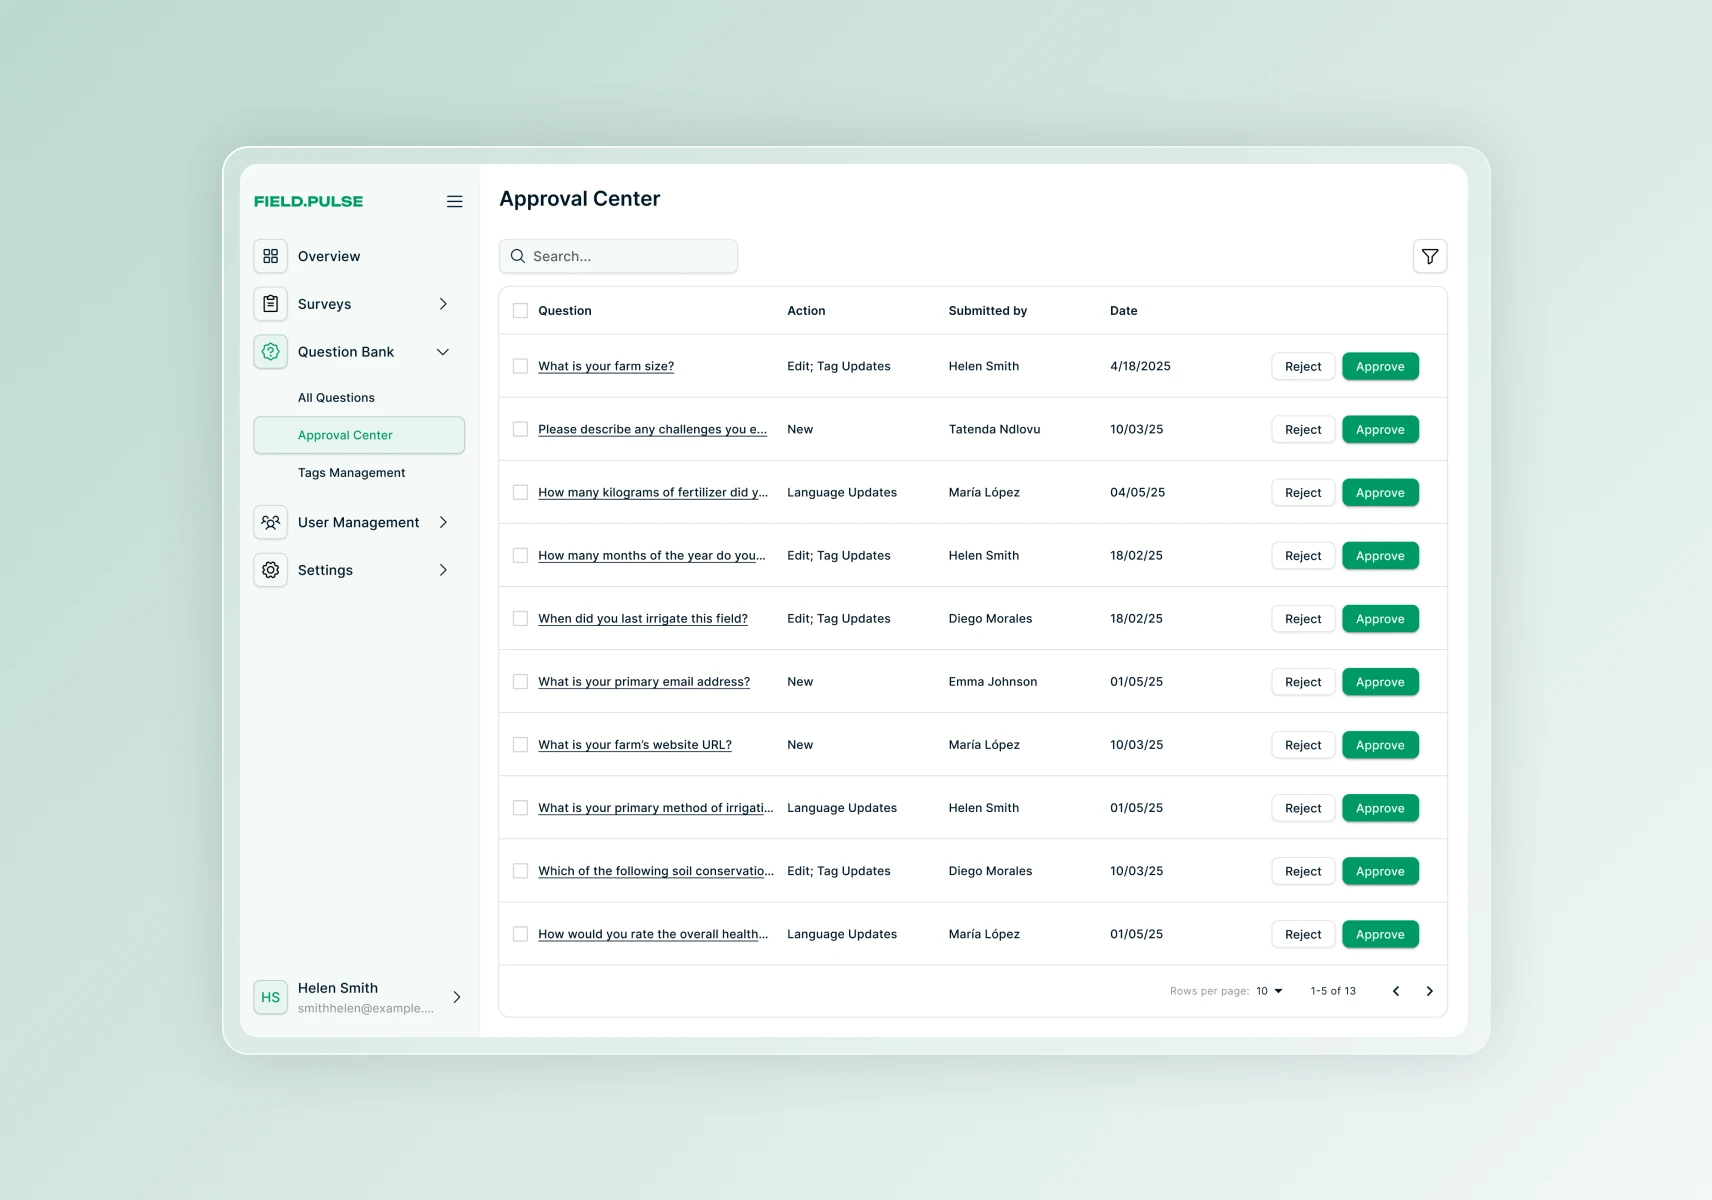
APPROVAL CENTER
A dedicated workspace for reviewing and managing newly submitted questions. See each question’s details — tags, translations etc in a list view, then quickly approve, reject with feedback, or request edits. This keeps the Question Bank clean and ensures only vetted content is used in surveys.
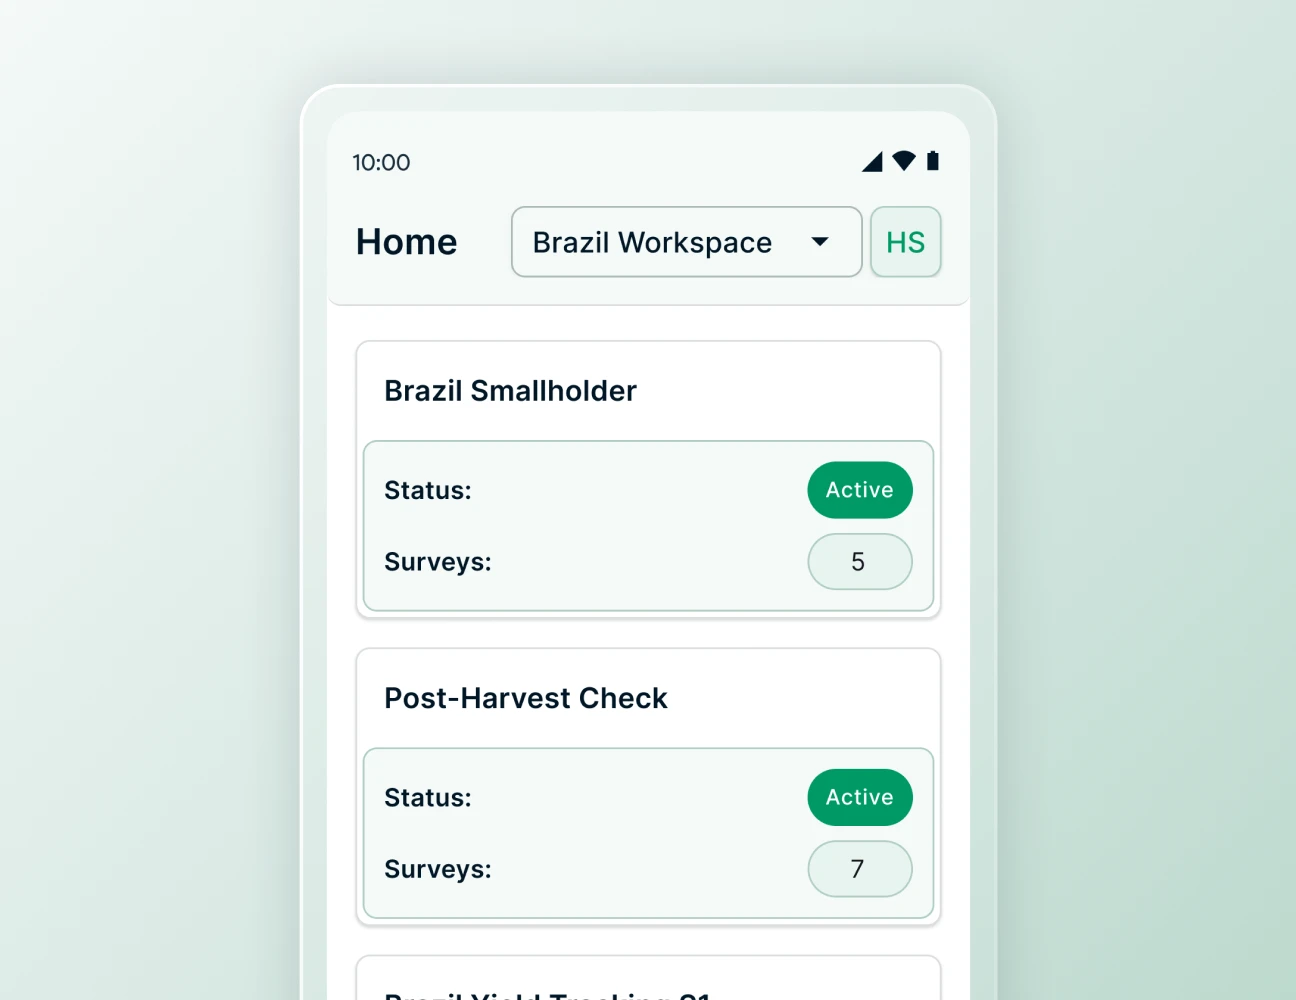
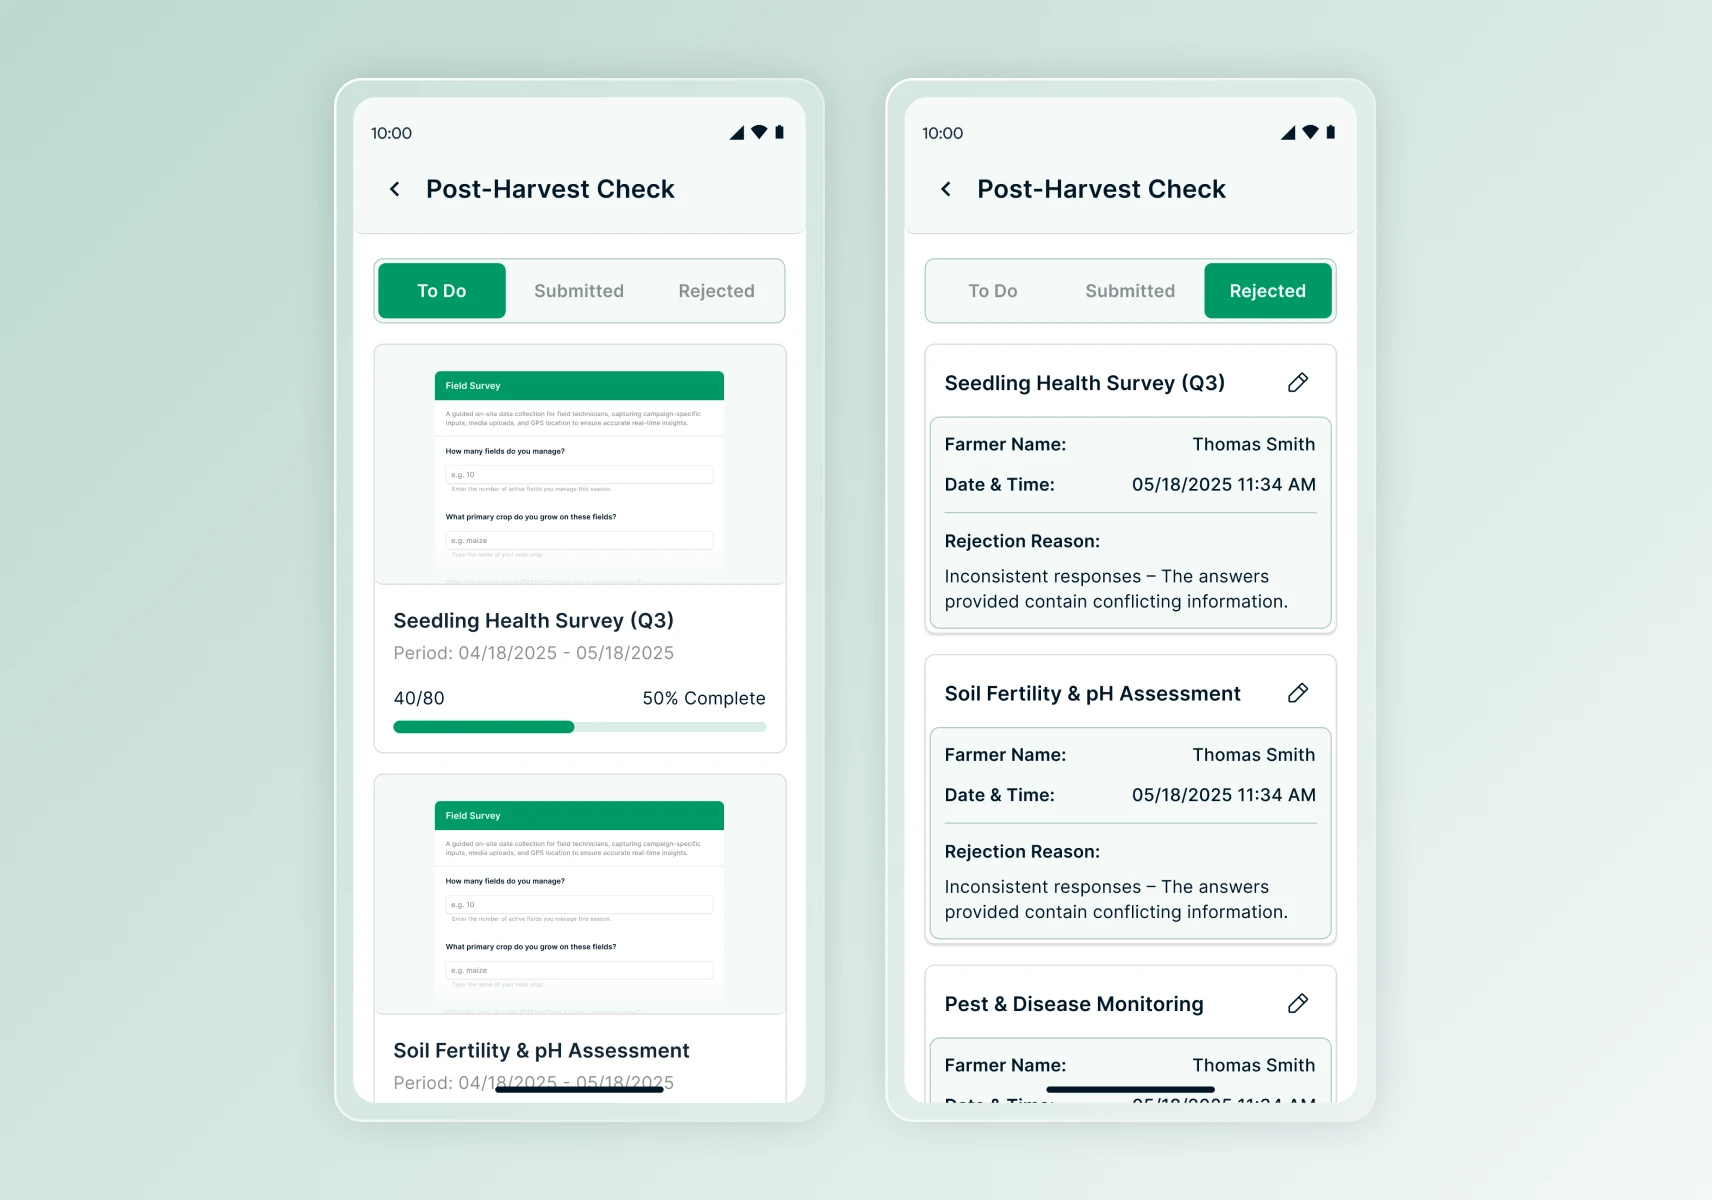
MOBILE APPLICATION
A streamlined companion for Field Technicians, providing offline-capable survey execution and real-time campaign assignments. Upon login, users select their active campaign and see a personalized list of assigned surveys.
Each survey begins with a farmer selector to ensure unique submissions, then guides technicians through questions—number inputs, photo capture, geo-tagged locations, and more—with intuitive navigation and validation. Completed responses sync automatically when connectivity returns, and users can review or edit recent submissions directly on their device.
SURVEY BUILDER
An intuitive drag-and-drop interface that lets administrators assemble surveys from the Question Bank, configure conditional logic, and set up dynamic behaviors with just a few clicks.
It supports a wide range of question types — including number inputs, map-based location selectors, dropdowns, date pickers, and more—to capture any kind of field data.
CAMPAIGNS MANAGEMENT
A straightforward interface for creating campaigns: choose a farmer list, assign field technicians, and select which surveys to include. Once a campaign is live, admins can return to the same view to track survey progress—seeing how many farmers each technician has completed.
QUESTION BANK & BUILDER
A central library of reusable questions, each with metadata tags and multi-language support. Admins can categorize, send for approval, and manage translations, then drag questions directly into surveys. This ensures consistency across campaigns and speeds up survey creation by leveraging pre-built, standardized question components.
APPROVAL CENTER
A dedicated workspace for reviewing and managing newly submitted questions. See each question’s details — tags, translations etc in a list view, then quickly approve, reject with feedback, or request edits. This keeps the Question Bank clean and ensures only vetted content is used in surveys.
MOBILE APPLICATION
A streamlined companion for Field Technicians, providing offline-capable survey execution and real-time campaign assignments. Upon login, users select their active campaign and see a personalized list of assigned surveys.
Each survey begins with a farmer selector to ensure unique submissions, then guides technicians through questions—number inputs, photo capture, geo-tagged locations, and more—with intuitive navigation and validation. Completed responses sync automatically when connectivity returns, and users can review or edit recent submissions directly on their device.
Conclusion
Results and Impact
Optimized User Experience
A simplified, user-friendly interface across web and mobile platforms reduced training time by 60%, allowing field teams to become fully operational in under 2 days. Users reported a 40% improvement in task completion speed.
Custom Features Developed
The introduction of the reusable Question Bank and Survey Builder eliminated repetitive setup tasks, cutting campaign creation time by 50%. These custom features streamlined workflows and improved consistency across all regions.
Scalable Architecture
Thanks to a flexible design system, the platform successfully expanded to 5 new regions and supported 3 additional languages within the first 3 months after launch — all without redesign or reengineering.
Actionable Field Insights
With real-time tracking and offline capabilities, field data accuracy increased by 35%, and survey completion rates rose by 28%. Campaign managers were able to adjust live campaigns instantly based on real field input.