Background
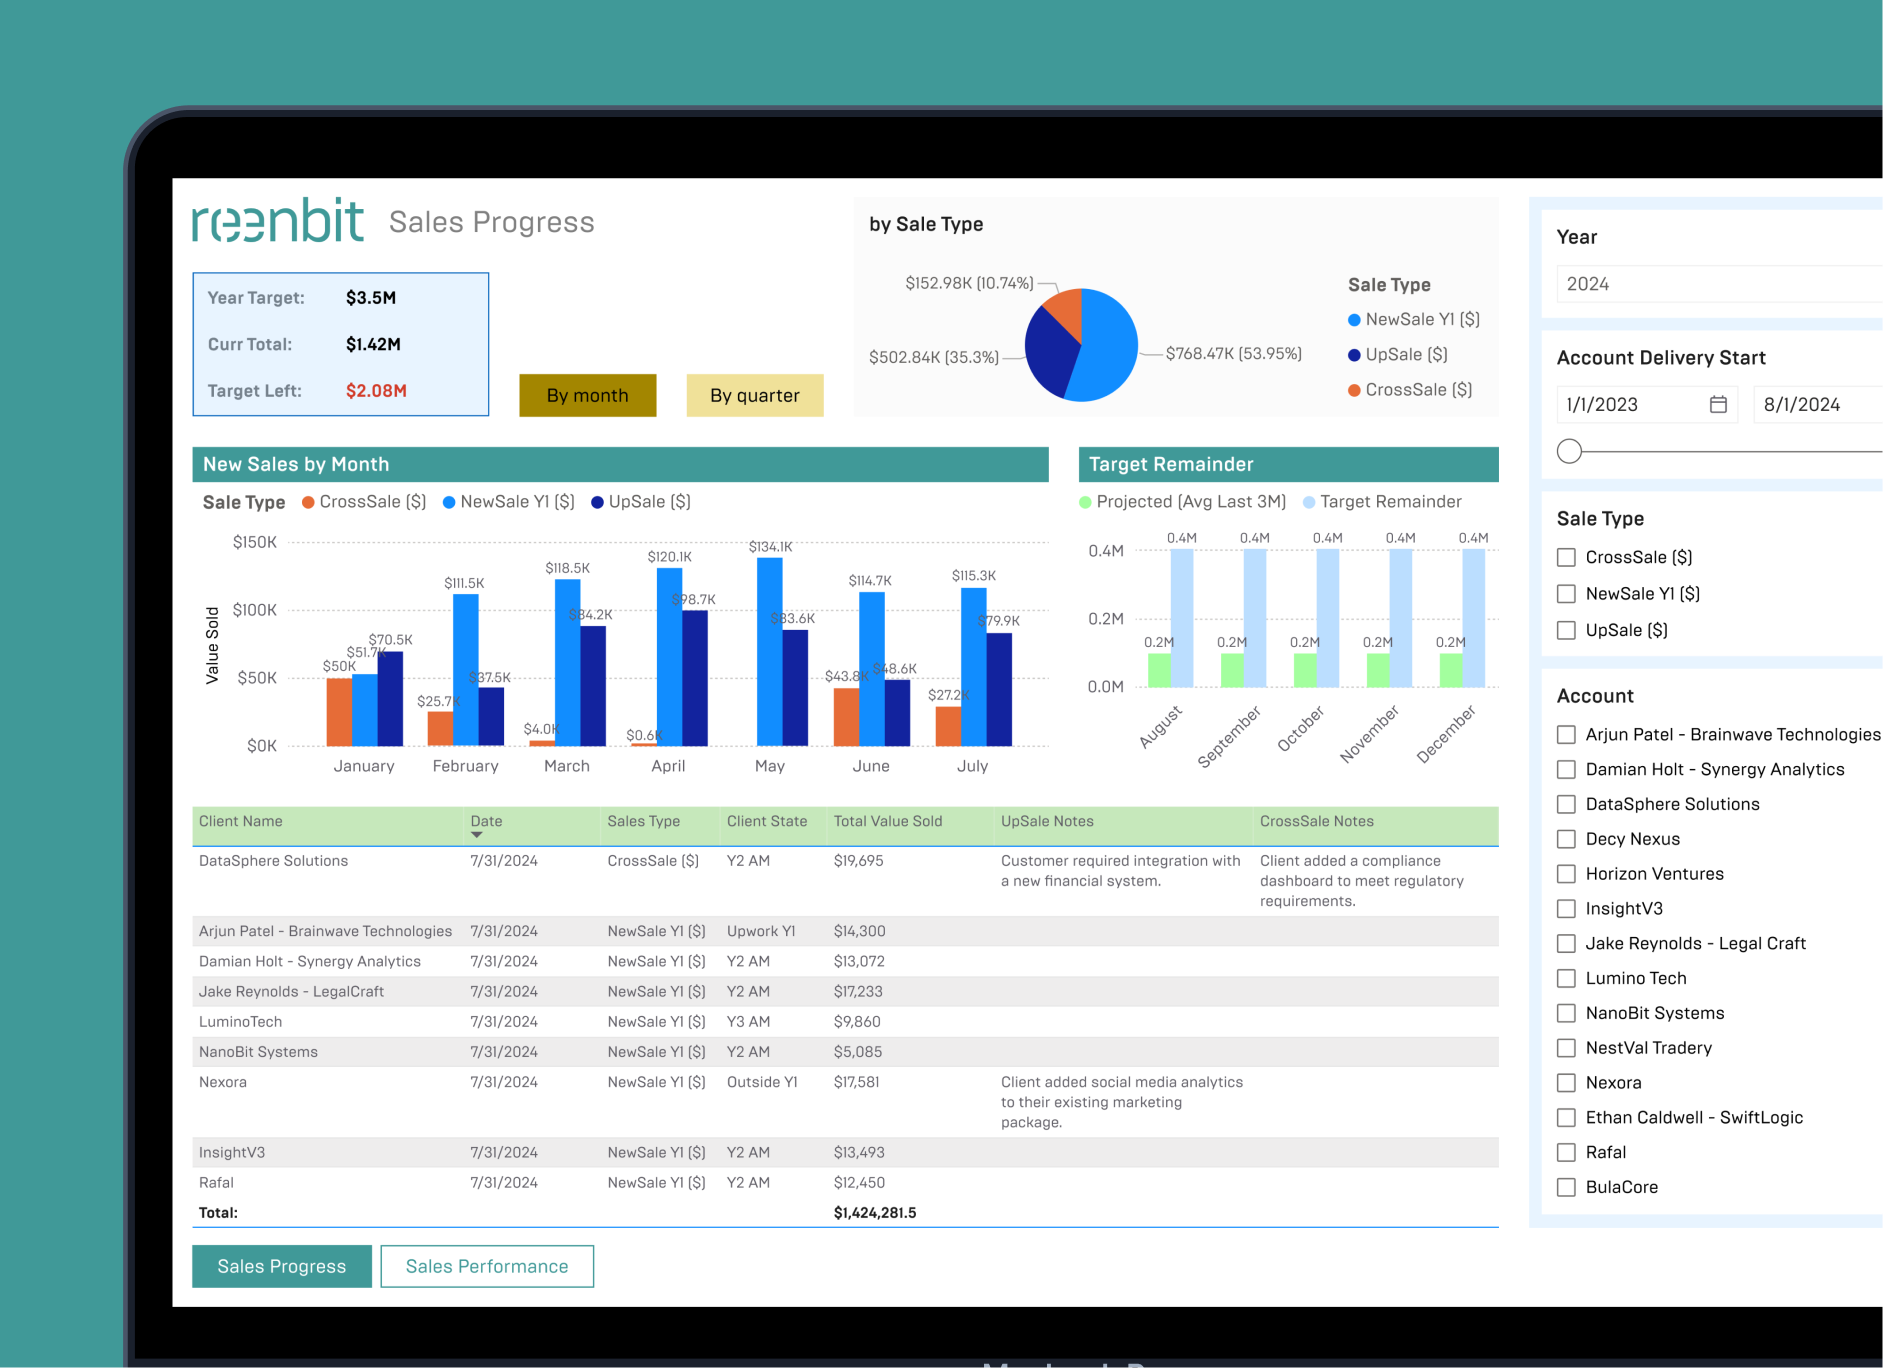
Our team recently completed an advanced Power BI analytics project for an IT Services company struggling to gain insights into its sales performance indicators. Despite setting yearly and quarterly sales targets, the company lacked a precise mechanism to assess progress against these goals. Additionally, they needed to understand sales trends over time and determine future sales required to meet their objectives.
Challenges
The initial dataset provided by the client was insufficiently detailed. It contained only monthly total sales figures, without critical attributes such as client information, sale type (new sale, upsell, cross-sale), or currency variations. This lack of granularity made it impossible to analyze sales trends effectively.
The company faced several key business challenges::
- Unclear Sales Performance Metrics: no structured approach to track sales against targets.
- Limited Forecasting Ability: no way to estimate whether the team was on track to achieve sales goals.
- Currency Conversion Complexity: sales were recorded in multiple currencies without a consistent comparison method.
- Lack of Client-Based Insights: no way to assess which clients contributed most to revenue growth.
Features
To address these challenges, we implemented the following key Power BI analytics features:
- Sales Performance Tracking by Month and Quarter
- Breakdown of Total Sales by Sale Type (New Sale, Upsell, Cross-Sale)
- Target Remainder Analysis: calculates the gap between actual and target sales and distributes the remainder across future months.
- Projected Sales Forecasting: compares future target requirements against recent sales trends to determine whether new contracts are needed.
- Multi-Dimensional Filtering: includes Year, Account Delivery Start, Sale Type, and Client.
- Drill-Down to Transaction Level: allows users to view detailed sales transactions with all relevant attributes.
- Sales Performance by Client Over Time: identify the most valuable clients based on revenue contribution.
- Year-To-Date (YTD) Sales Breakdown: provides cumulative insights into sales performance by sale type.
- User-Friendly Navigation: enables seamless switching between different views and metrics within Power BI.
- Custom Tooltips: additional insights are displayed using dedicated Power BI tooltip pages for deeper analysis.
Solution
The project was built on Azure Cloud using a robust data pipeline architecture, ensuring secure and scalable data processing:
Data Ingestion
- Source data was extracted from various internal systems and ingested into Azure Blob Storage.
- Sales invoices were converted to a single base currency for accurate analysis.
- A dimensional data model was designed in Snowflake to support advanced analytics.
Data Processing & Transformation
- Azure Data Factory was used to process and clean raw data.
- Sales invoices were converted to a single base currency for accurate analysis.
- A dimensional data model was designed in Snowflake to support advanced analytics.
Data Warehousing & Analytics
- Snowflake was utilized as the primary data warehouse, ensuring high performance and scalability.
- Data pipelines enabled automated updates, keeping reports up to date with the latest insights.
Data Vizualization & Reporting
- Power BI was used to develop interactive dashboards.
- The report was structured with drill-down capabilities and intuitive navigation features, providing a web-like experience for users.
Outcome
Our Power BI solution delivered measurable improvements across sales tracking and forecasting:
Our implemented features include the following:
- Increased Sales Visibility: the company gained real-time insights into sales performance across clients, sale types, and time periods.
- More Accurate Forecasting: with the target remainder analysis, the company could proactively adjust sales strategies to close gaps and achieve goals.
- Revenue Growth Focus: leadership identified high-value clients and refined sales strategies accordingly.
- Better Decision-Making: executives could seamlessly analyze key metrics and intervene when necessary.
With this fully automated and scalable Power BI solution, the company now has an efficient, data-driven approach to sales management, ensuring sustained business growth and improved strategic decision-making.

