How to Transform Data in Power BI: A Step-by-Step Guide
Power BI earns its value through how well data is transformed. When practices are structured, reporting remains fast, accurate, and trusted, even as demands grow. In fact, industry studies show the impact goes far beyond efficiency. Companies that have adopted this discipline have seen measurable results of over 366% ROI in three years and 125 hours saved per BI user annually. But how do you achieve the same for your business?
This guide outlines how to transform data in Power BI. We also highlight cases and best practices that show how data can function as a strategic asset for your overall business benefit. Read on!
What is Power BI, and its data transformation capabilities?
Power BI is Microsoft’s flagship analytics platform, built for visualization and large-scale data preparation and transformation. It connects to almost any data source, reshapes information into a consistent structure, and creates models that support reliable reporting. This data transformation in Power BI empowers business teams to take care of data processing themselves, reducing dependency on IT.
Overview of Power BI Desktop vs. Power BI Service
- Power BI Desktop is the primary environment for data preparation. Here, analysts connect to raw sources, perform transformations in the Power Query editor, and design the data model.
- Power BI Service is the cloud-based platform used to publish, share, and collaborate. It’s powerful for distribution and monitoring, but advanced transformations remain a Desktop task before publishing.
A practical way to think of it: Desktop is where the heavy lifting of transformation happens; the Service is where insights are consumed.
Core components of Power BI
Power BI Desktop is organized around three main views, each serving a different role in shaping data into insights.
These components above, guide users from raw input to polished, decision-ready outputs.
Introduction to Power Query Editor
The Power Query Editor is the central engine used to transform data in Power BI. It gives users a structured, step-by-step workspace to clean, reshape, and enrich data before it reaches the model. Typical tasks in Power Query include:
- Changing data types, thus ensuring fields calculate correctly.
- Splitting or merging columns to organize information consistently.
- Removing null values that disrupt aggregations and reports.
- Pivoting and unpivoting tables to reshape datasets for analysis.
Each action is recorded in the Applied Steps pane, making the process transparent and reproducible. For complex scenarios, the M language enhances how Power BI transforms data, facilitating customization beyond the standard interface.
With the editor’s role clear, let’s move into the first steps of using it effectively.
Getting started with Power Query Editor
The Power Query Editor is the staging area where raw inputs are shaped into analysis-ready data. Every decision made here determines whether reports run well or fail under the weight of poor data.
How to launch the Query Editor
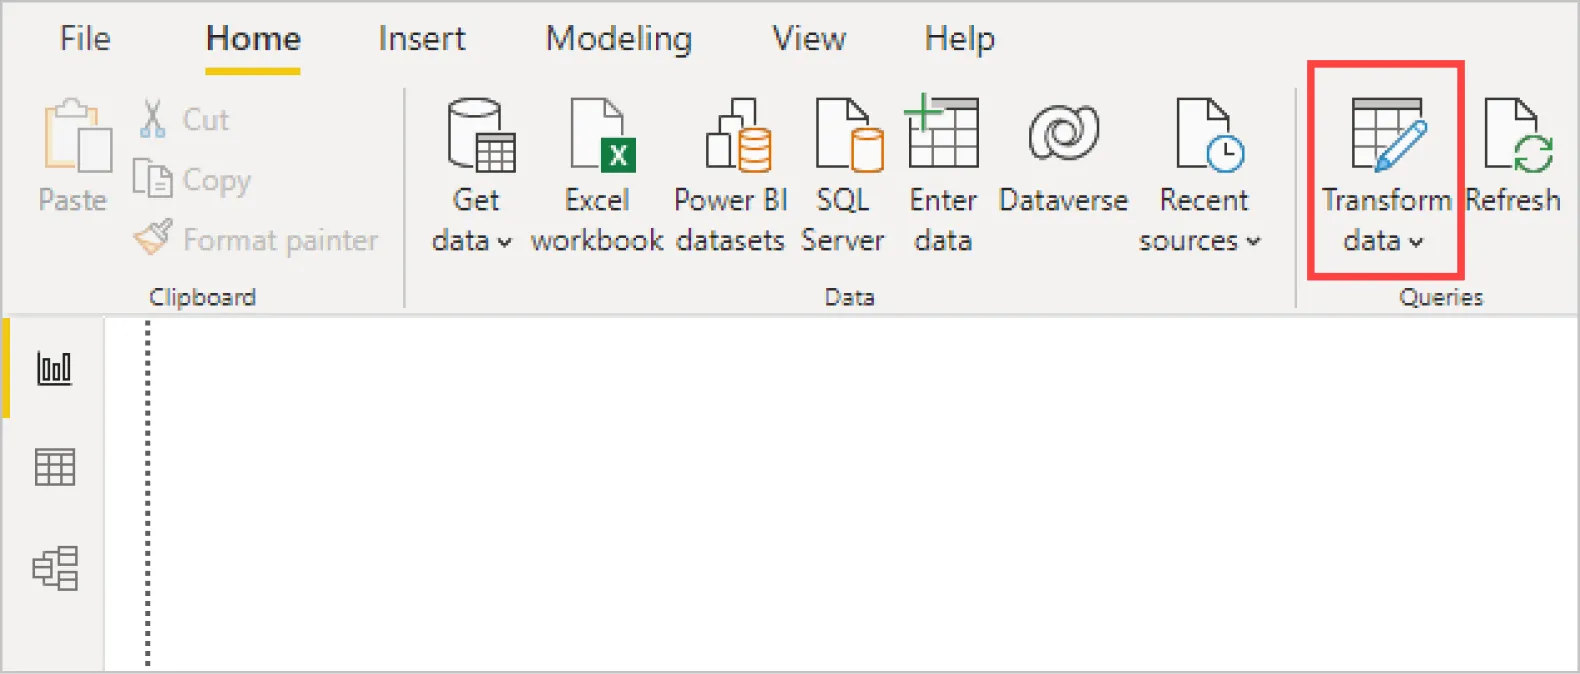
In Power BI Desktop, the editor opens through Home > Transform data. Opening the editor moves you from the reporting layer into the workspace where tables, fields, and transformations are defined. From this point forward, every action is logged, creating a transparent and reversible record of the workflow.
Importing data from different sources (Excel, SQL, Web, APIs)
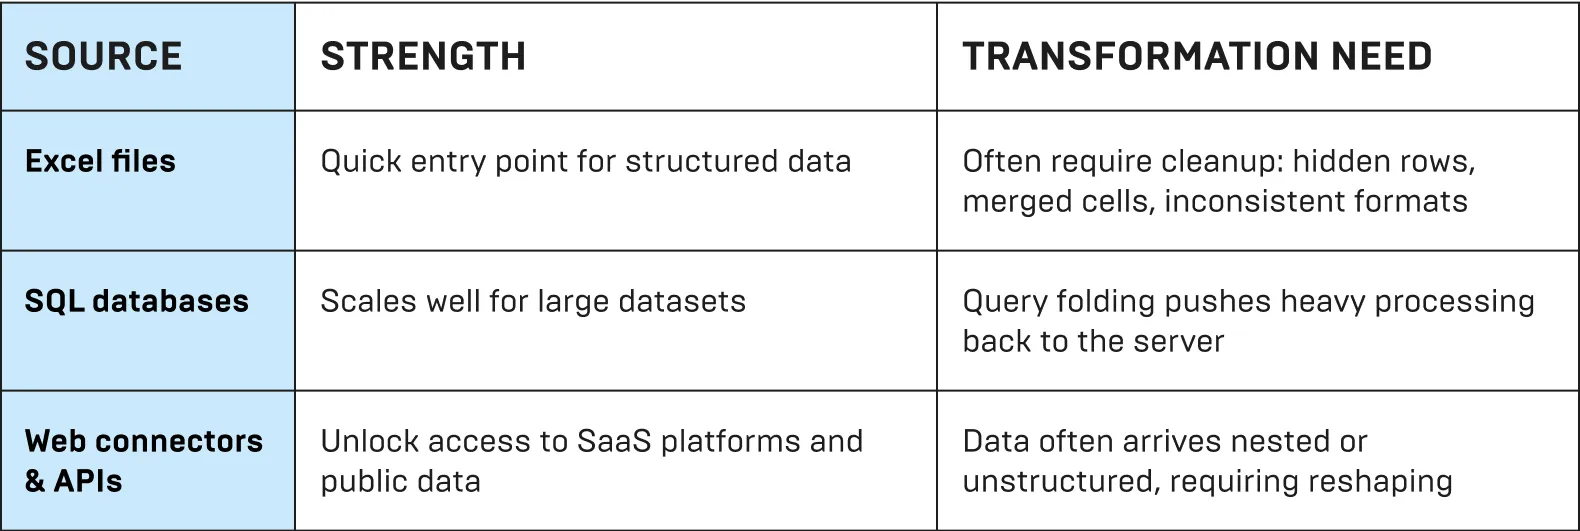
Power BI connects to many data sources, each with distinct strengths and transformation needs.
With the sources in the Editor, transformations stay consistent and reliable. This reduces inconsistency and errors.
Understanding the Navigator window
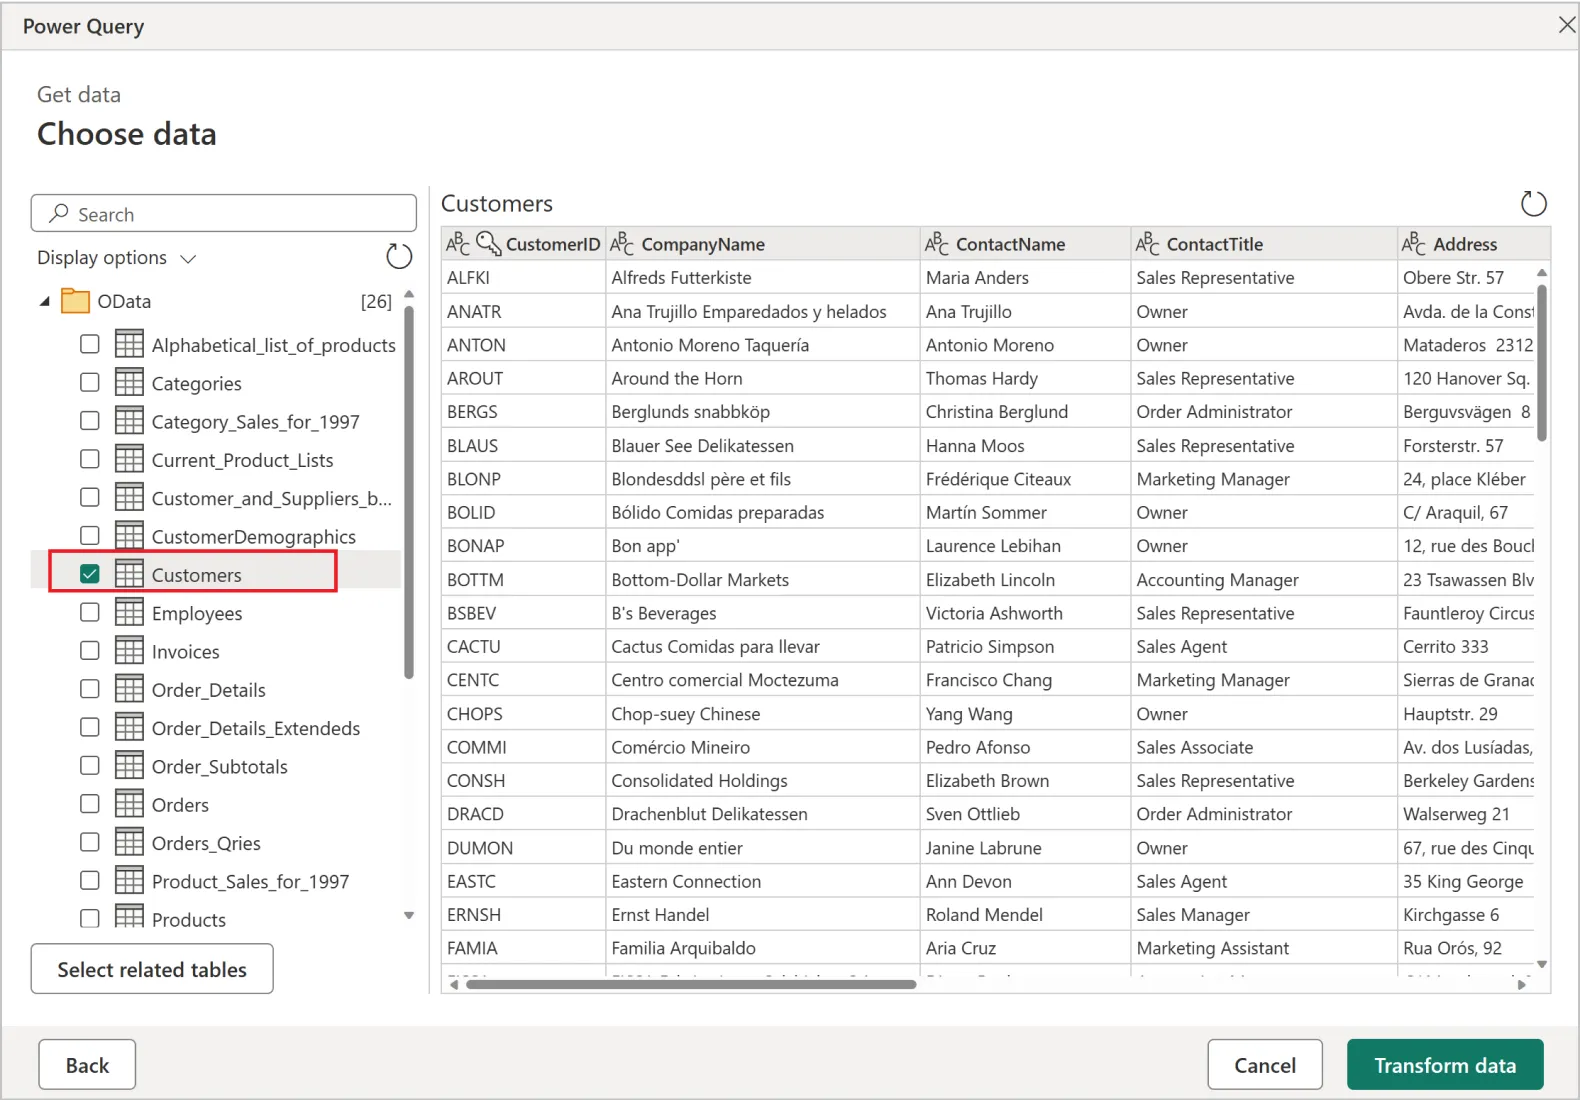
When a data source is chosen, the Navigator window previews available tables and fields. Its strategic value lies in filtering: choosing only what is relevant keeps models lean, improves refresh times, and limits downstream complexity. For large datasets, this first cut often determines whether a dashboard feels responsive or sluggish.
Once data is connected and scoped, the real transformation work begins.
How to transform data in Power BI: Essential steps
The actions below take raw inputs and shape them into reliable models that drive performance and clarity in reporting.
1. Cleaning and structuring data
CRM exports often contain duplicates, gaps, or messy formats. But, it’s always important to maintain clean data at this stage, which prevents errors later in DAX calculations. To solve this, use Remove Duplicates to eliminate repeated entries, Trim to clean stray spaces, and Fill Down to handle missing values.
2. Column operations
Columns control how data connects across reports. To have well-structured columns that simplify joins and improve readability, split full names, merge city and postal codes, and rename headers to match naming conventions.
3. Data reshaping
Exports rarely match the structure needed for analysis. Use tools like Transpose to convert rows into columns, or Unpivot Columns to normalize nested data. This isn’t about summarizing yet, it’s about structuring raw inputs so later pivots and aggregations produce clean, comparable results.
4. Combining and integrating data
Insights grow when data from different systems is brought together. Integrating CRM, ERP, marketing, or finance sources in Power BI creates a unified view of performance and eliminates siloed reporting. At this stage, the goal is to align definitions, ensure consistent formats, and establish a single source of truth that supports cross-functional analysis.
5. Using conditional columns
Rules can be automated directly in Power Query. Apply Conditional Columns to flag high-value orders, assign regions, or tag overdue invoices. Embedding logic early ensures consistent classification across refreshes.
6. Changing data types
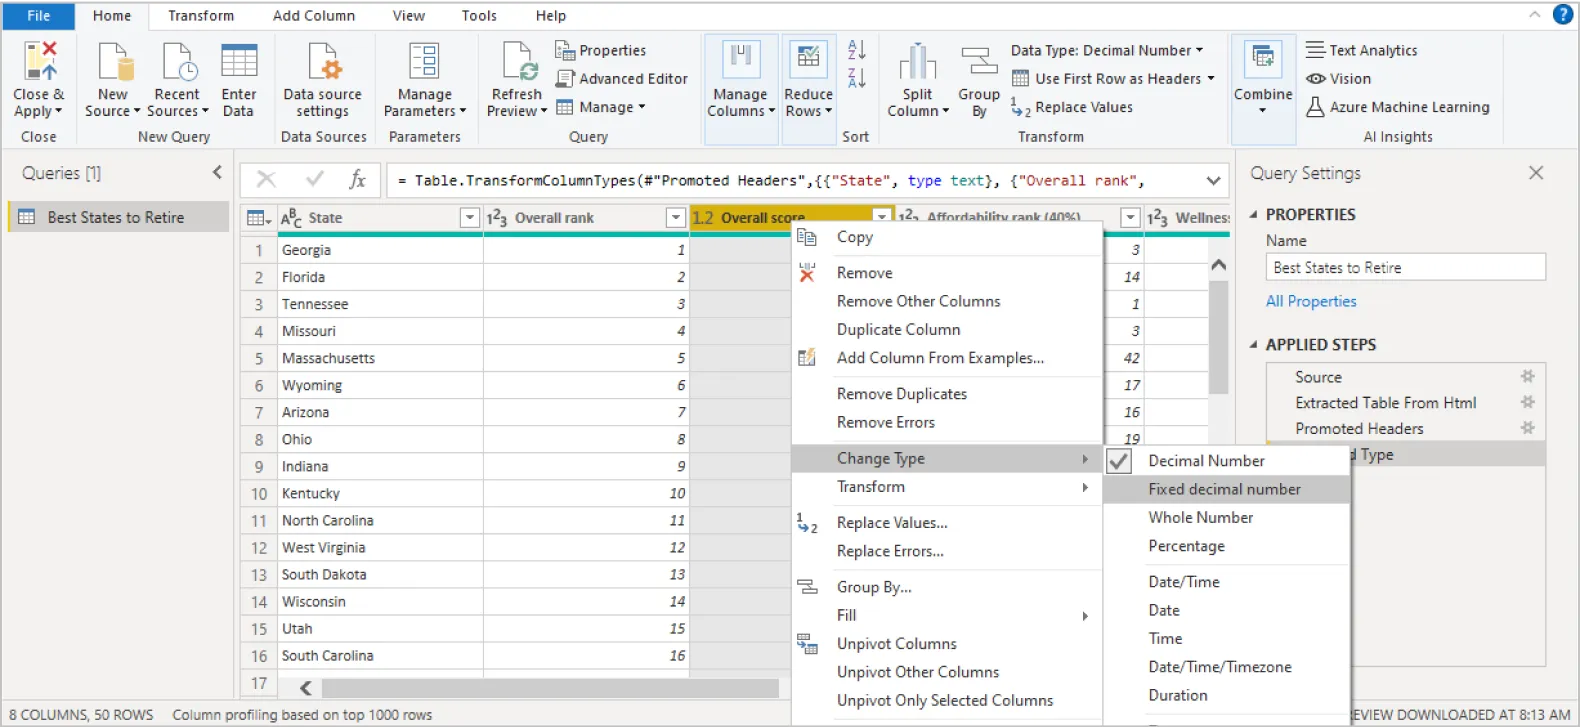
Data types dictate calculation accuracy. Convert text dates into Date/Time to unlock YTD functions, or set currencies as Decimal Number for precise financial models. Correct types improve both accuracy and performance.
7. Replacing or removing values
Placeholder entries distort results. Replace “9999” with null, standardize “N/A” into “Unknown,” or remove test rows that don’t belong. Clean values maintain reporting credibility.
8. Pivoting and unpivoting
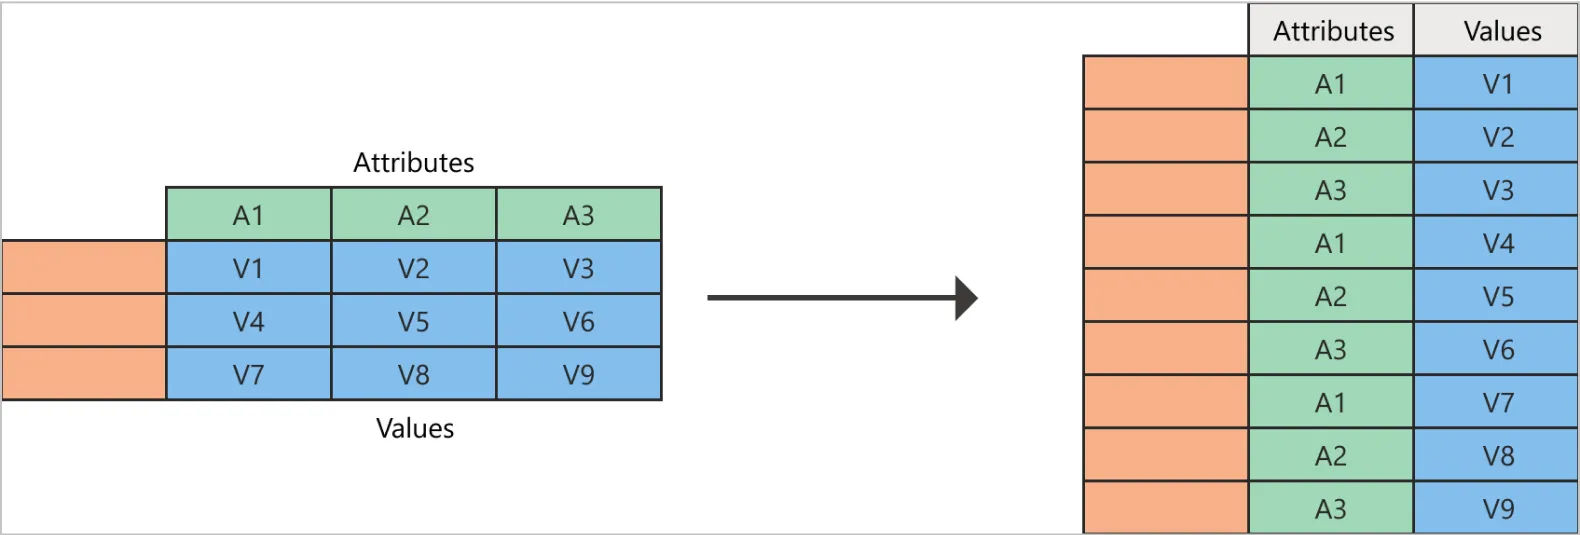
Pivoting creates summaries by turning row values into columns: for example, showing total sales by region in a compact table. Unpivoting does the reverse: it flattens wide tables (like Q1, Q2, Q3 columns) into a single “Quarter” field with values.
Together, Pivot and Unpivot columns let the same dataset support high-level dashboards for executives and detailed analysis for specialists.
9. Merging and appending queries
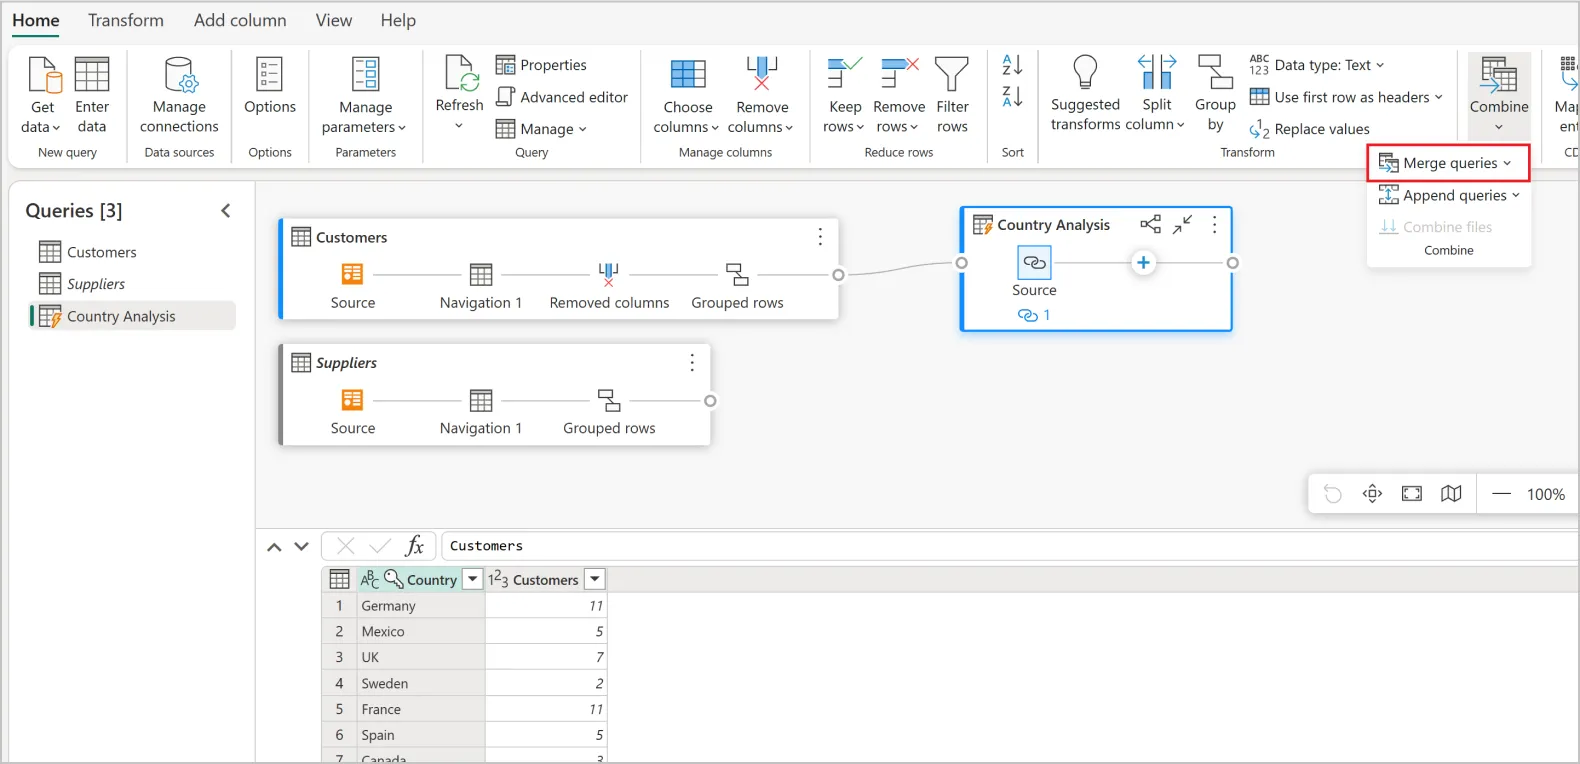
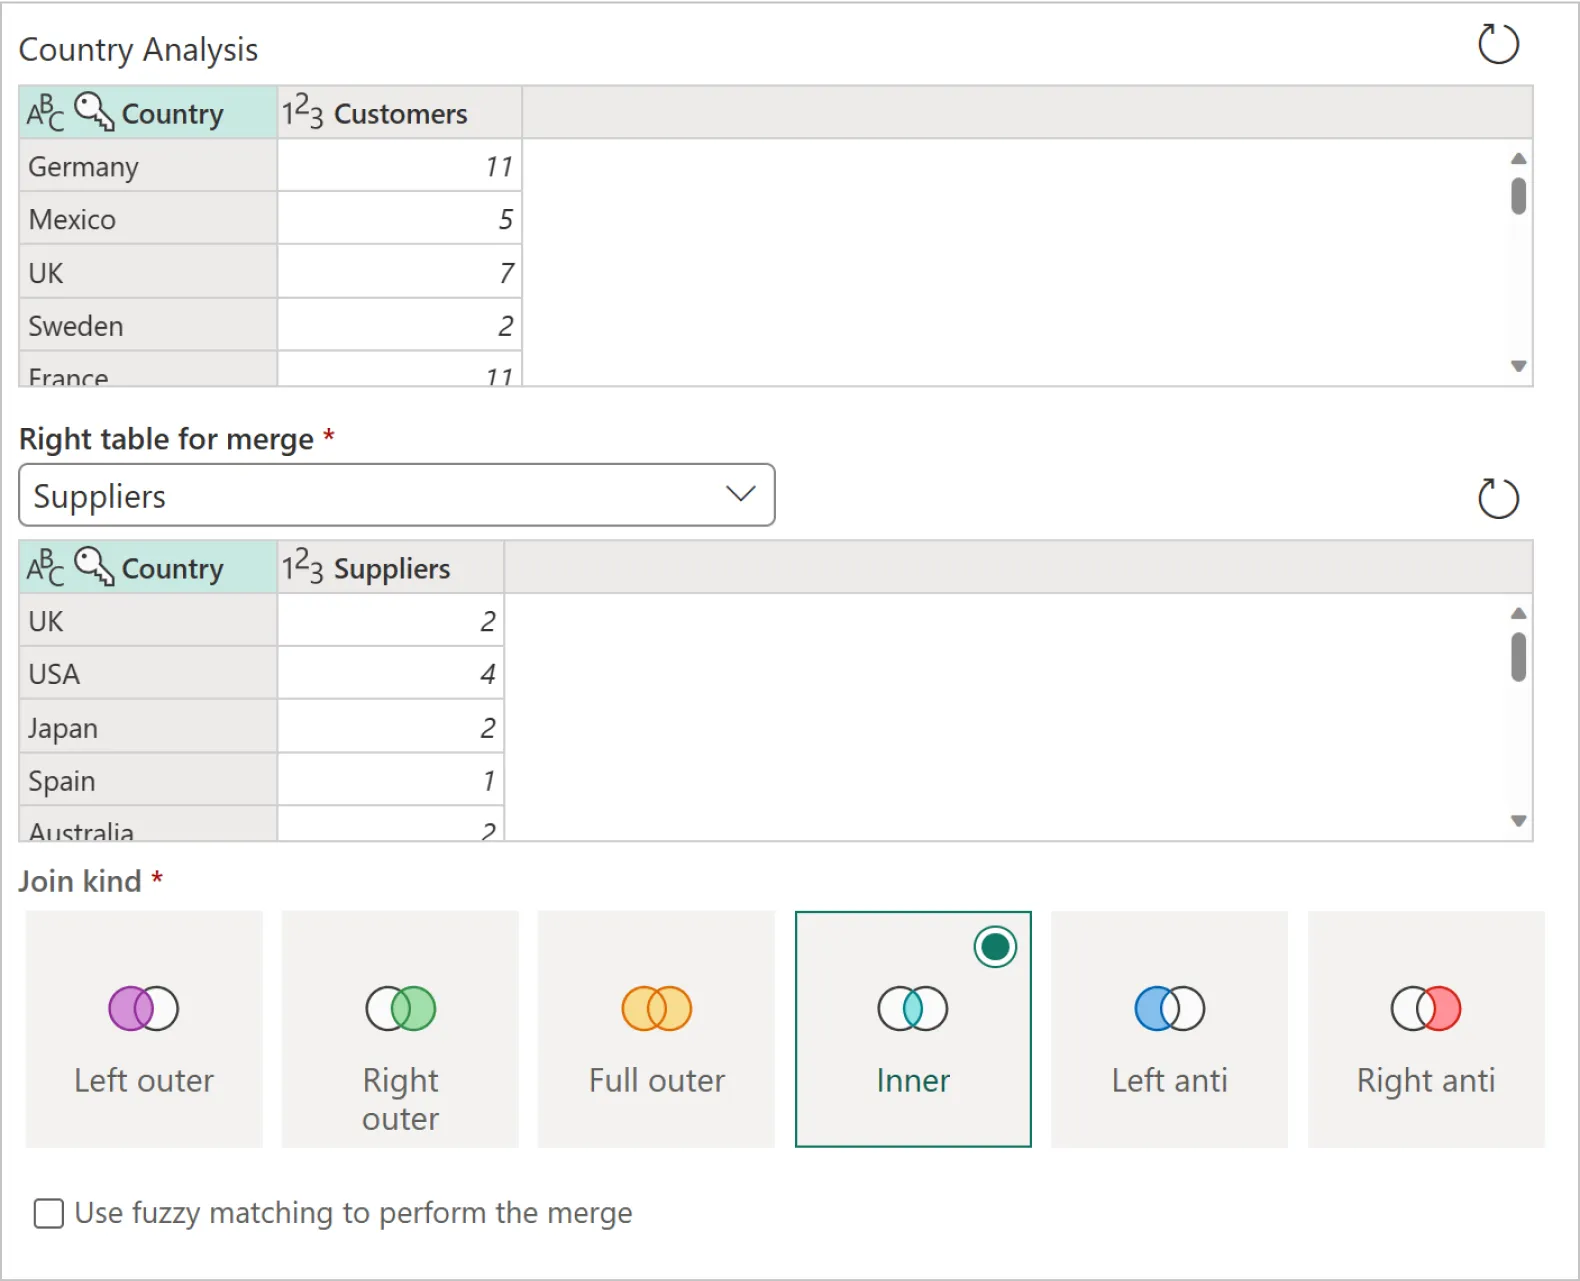
Merging combines tables side by side based on a common key: for example, linking customer IDs from a CRM export with order data from an ERP system. Appending stacks datasets with the same structure, like monthly Excel reports, into a single fact table. Use these operations to remove silos, expand coverage, and create unified models that scale.
10. Aggregating data
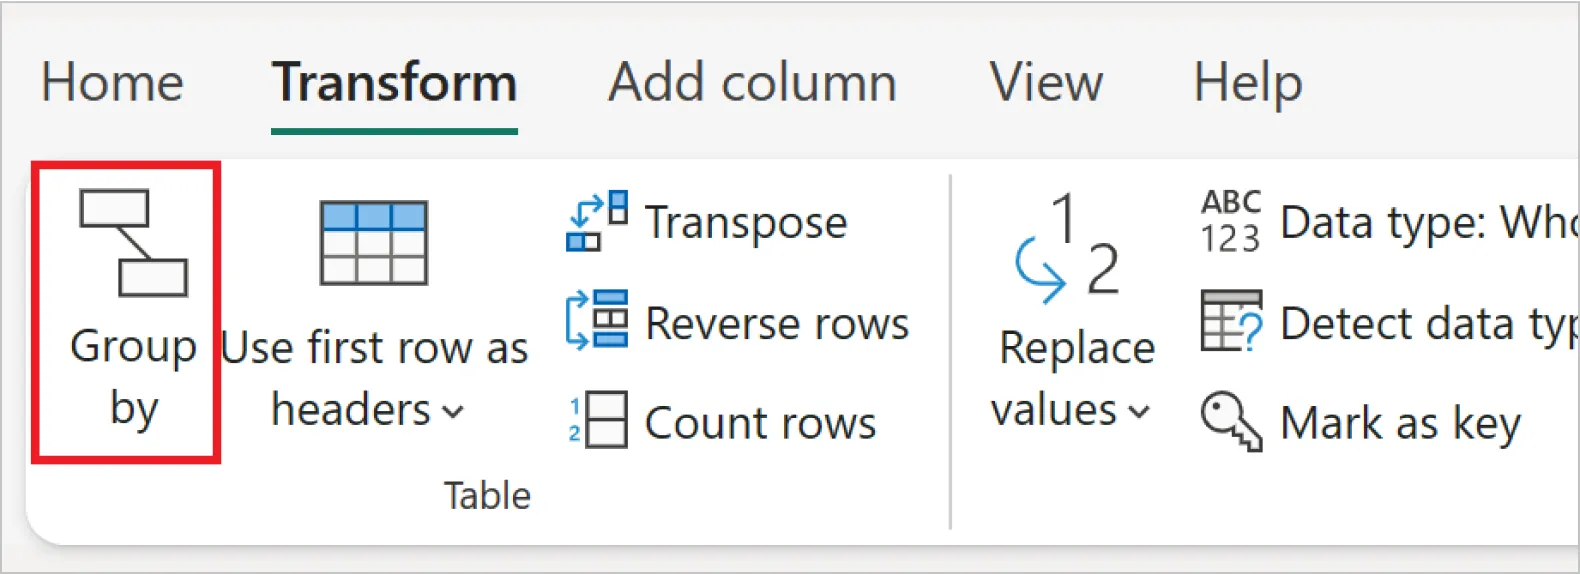
Aggregation distills detail into clarity. With Group By, millions of rows become concise KPIs like totals, averages, or rolling trends. Aggregated data refreshes faster and gives leaders the metrics they need.
These basics cover most reporting needs. For larger models, advanced techniques take over.
Advanced data transformation in Power BI
Power BI has two engines that drive advanced transformation: M and DAX. Knowing when to use each is the difference between quick fixes and scalable, enterprise-ready solutions.
Power Query M language
M is the scripting language that runs in Power Query, shaping and cleaning data before it enters the model. Each “Remove Duplicates,” “Unpivot Columns,” or “Change Type” action translates into M behind the scenes.
Writing M directly gives analysts more control: parameterized queries that adapt to schema drift, functions that reshape thousands of files at once, and automation that cuts refresh times dramatically. In enterprise deployments, M is the layer that governs data ingestion at scale, long before dashboards reach executives.
Using DAX for data transformation
DAX (Data Analysis Expressions) is the formula language inside the data model itself, creating calculations, measures, and relationships after the data is loaded. It begins where M stops.
While M prepares the raw material, DAX defines how it behaves in analysis. With calculated measures and tables, DAX handles year-over-year growth, rolling forecasts, cohort tracking, and segmentation by customer behavior. Functions like CALCULATE, SUMMARIZECOLUMNS, and FILTER allow models to respond instantly to user selections.
Put simply, DAX is the language of business logic, ensuring reports mirror the way leadership measures performance.
M vs. DAX: Drawing the line
M prepares data so it loads cleanly and efficiently. DAX shapes that data into answers that reflect business priorities.
However, if you push too much into DAX, reports slow under the weight of on-the-fly calculations. Also, pushing too much into M causes refresh cycles to drag. This is why high-performing teams set the boundary deliberately: M for shaping and optimization, DAX for business logic and analysis. That balance is what keeps models both scalable and responsive.
Theory matters, but the real value shows in practice. Let’s see how organizations apply these transformations.
Power BI data transformation: Common use cases
Power BI proves its worth when applied to specific business problems. Transformations go beyond formatting tables; they solve operational headaches and deliver insights leaders can act on.
Preparing marketing data
Marketing data is notoriously fragmented. Ad platforms, CRMs, and email systems all define metrics differently, making cross-channel reporting painful. Power BI data transformation brings them together by unpivoting wide tables, aligning naming conventions, and standardizing spend metrics. Campaign ROI can be tracked across channels in one model, letting marketers reallocate budget while campaigns are still running.
Sales and financial data cleaning
Finance teams often spend days reconciling regional reports with different currencies and formats. Power Query enforces currency conversions and data types, while DAX handles rolling forecasts and revenue breakdowns.
In practice, this approach turned static reporting into live sales tracking for an IT services company. Reenbit built a Power BI system that added client-level visibility, automated multi-currency conversion, and forecasting logic. Managers could finally see whether they were on track to hit targets, and adjust strategy before gaps widened.
Customer analytics
Customer insight comes from merging the characteristics of buyers with how they behave. Power BI integrates CRM profiles with transaction or digital-activity data, then applies DAX to build churn models, cohorts, and segmentation. Businesses transition from tracking past purchases to identifying at-risk customers and understanding which groups drive growth.
Handling large datasets efficiently
Enterprises deal with millions of records across years of operations. Power BI scales with query folding, incremental refresh, and aggregation tables, keeping dashboards responsive while retaining detail where it matters.
A consulting firm applied this at scale with Reenbit’s cost-reduction BI solution. Automated pipelines and standardized Power BI templates replaced manual spreadsheets, cutting reporting overhead and surfacing inefficiencies. Leadership gained faster access to cost drivers, enabling decisions backed by benchmark comparisons rather than guesswork.
However, even the best-designed workflows hit roadblocks. Here are the most common, and how to address them.
Common challenges and how to overcome them
Even with the right tools, organizations often hit the same roadblocks when transforming data in Power BI. The table below highlights the most common challenges and practical ways to resolve them.
Challenge
How to overcome it
Handling large or complex datasets
Use query folding, incremental refresh, and aggregation tables to reduce load and keep dashboards responsive as data scales.
Managing inconsistent or “dirty” data
Apply Power Query to clean duplicates, fill gaps, and standardize formats. Combine with governance practices to sustain quality. See also Power BI vs Excel.
Balancing between M and DAX
Use M for data ingestion and structure before load, and DAX for calculations inside the model. Balance both to avoid slow refreshes or sluggish visuals.
Collaboration and documentation of transformation steps
Utilize the Applied Steps pane, enforce naming conventions, and store logic in shared repositories to create transparency and continuity.
Challenge
Handling large or complex datasets
How to overcome it
Use query folding, incremental refresh, and aggregation tables to reduce load and keep dashboards responsive as data scales.
Challenge
Managing inconsistent or “dirty” data
How to overcome it
Apply Power Query to clean duplicates, fill gaps, and standardize formats. Combine with governance practices to sustain quality. See also Power BI vs Excel.
Challenge
Balancing between M and DAX
How to overcome it
Use M for data ingestion and structure before load, and DAX for calculations inside the model. Balance both to avoid slow refreshes or sluggish visuals.
Challenge
Collaboration and documentation of transformation steps
How to overcome it
Utilize the Applied Steps pane, enforce naming conventions, and store logic in shared repositories to create transparency and continuity.
Addressing these challenges takes technical discipline supported by transparent governance. While many organizations manage the basics internally, they turn to external expertise, such as Reenbit’s BI Services, when scaling models, cleaning complex pipelines, or establishing transformation standards. This ensures technical execution aligns with business outcomes.
Addressing problems is only half the story. To stay ahead, teams follow a set of proven best practices.
Best practices for effective data transformation in Power BI
In Power BI, the difference between a smooth, trusted model and a slow, unreliable one often comes down to discipline. Following best practices ensures data transformations scale with the business, stay transparent, and deliver accurate insights when it matters most.
Plan your data model before transformation
Jumping into transformations without a clear model leads to rework and conflicting logic. Define relationships, key tables, and business rules up front, then shape transformations to support that structure. This upfront planning keeps reports consistent and avoids costly redesigns later.
Document applied steps for transparency
Power Query logs every change, but the “why” behind each step is easy to lose. Documenting decisions, such as why a column was split or values were replaced, builds trust and makes handoffs smoother across teams. It also creates a knowledge trail that supports audits and regulatory reviews.
Reuse queries and transformations where possible
Rebuilding the same transformations across multiple queries creates drift and errors. Power BI allows you to reference queries or package logic into reusable functions. Standardizing this way reduces development time, improves consistency, and keeps your model aligned across datasets.
Regularly review and update transformations
Business systems and metrics change constantly. Without periodic reviews, models bloat and performance degrades. Reviewing steps quarterly (pruning old logic, optimizing queries, and updating rules) keeps reports accurate, fast, and trusted by decision-makers.
Final thoughts
Power BI data transformation is the foundation of effective analytics. When models are planned, logic documented, and M and DAX used in balance, organizations gain reporting that scales with confidence and delivers trusted insights to decision-makers.
At the same time, it’s essential to recognize the limits. Power BI’s built-in transformation tools work well for small projects, proofs of concept, and quick analyses. But in enterprise environments, transformations are usually moved outside Power BI to platforms such as Azure Data Factory or DBT. This makes pipelines more scalable, ensures transformations can be reused across BI tools, and allows data engineers and analysts to collaborate more effectively. Power BI then focuses on its strengths: DAX-driven calculations and compelling visualizations.
For companies that later decide to switch to another BI platform, this approach minimizes rework, since the transformation layer remains intact. In other words, choosing the right technology stack for integration, transformation, and visualization is what future-proofs analytics.
Reenbit, a business intelligence services company, helps organizations make these decisions, providing both consulting and implementation services. It ensures your BI systems remain efficient, scalable, and aligned with long-term strategy.
FAQ
What is the difference between Power Query and DAX in Power BI?
Power Query (M language) shapes and cleans data before it loads into the model. DAX defines calculations, measures, and business rules once the data is already in Power BI. In short, M prepares the data, DAX drives the analysis.
What are pivot and unpivot transformations, and when should I use them?
Pivoting creates compact summaries (e.g., sales by region), while unpivoting normalizes wide tables into long, analysis-ready formats (e.g., months in columns into a single “Month” field). Use them to reshape data so it fits reporting needs.
What is query folding in Power BI, and why does it improve performance?
Query folding pushes transformations back to the source system instead of processing them locally in Power BI. This reduces refresh times and improves scalability, especially with large datasets.
What is incremental data refresh, and when should I use it?
Incremental refresh loads only new or changed data instead of reloading the entire dataset. It’s best used for large fact tables, such as sales or transactions, where historical data rarely changes.
When should I use Power BI instead of Excel for data transformation?
Excel works well for small, ad-hoc data tasks. Power BI is better when you need scalable, repeatable transformations across multiple sources, with governance and performance built in.
How does Power BI compare to Looker Studio for data transformation tasks?
Power BI offers richer transformation capabilities through Power Query and DAX, making it stronger for complex modeling. Looker Studio focuses more on visualization, often relying on external prep tools for heavy data shaping.


